
Fig. 5
- ID
- ZDB-IMAGE-250902-76
- Publication
- Abramova et al., 2025 - Disruption of grin2A, an epilepsy-associated gene, produces altered spontaneous swim behavior in zebrafish
- All Figures
- Figures for Abramova et al., 2025
|
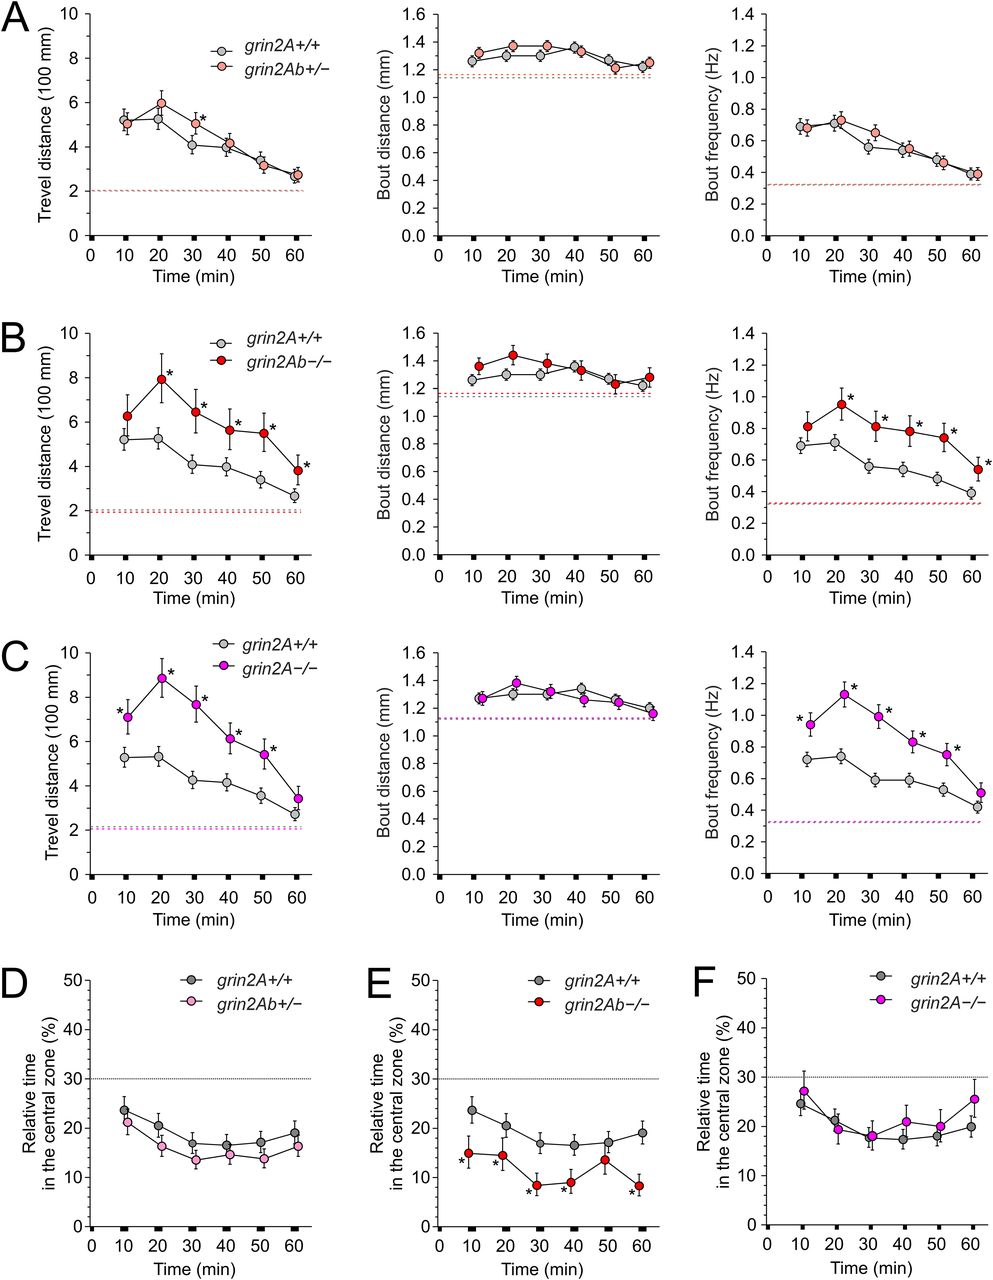
Fig. 5 Effects of grin2Ab deletion on larval swimming behavior and thigmotaxis. Comparison of MTD, MBD, and MBF of grin2Ab+/− (A), grin2Ab−/− (B), and grin2A−/− (C) larvae compared with grin2A+/+ larvae (6 dpf). Mean steady-state values of the locomotion parameters examined 2–3 h after the placement of larvae in the experimental wells are shown as dashed lines. For steady-state swimming parameters assessed 2–3 h after the larvae were placed in the experimental chambers, see Extended Data Figure 4-1. D, Comparison of thigmotaxis measured as the relative time spent in the central zone by grin2Ab+/−, grin2Ab−/−, and grin2A−/− larvae compared with grin2A+/+ larvae. The analysis of thigmotaxis was performed on the same larvae used to study locomotion. The dotted line indicates the level of randomness (30%). Data are expressed as mean ± 95% confidence interval of travel distance, bout distance, and bout frequency (A–C), and the relative time spent by larvae in the central zone (D) measured in 10 min intervals; * indicates significant differences in the genotype as assessed by ANOVA followed by LSD post hoc test (grin2A+/+, n = 584; grin2Ab+/−, n = 542; grin2Ab−/−, n = 197; grin2A−/−, n = 270). grin2Ab+/− versus grin2A+/+, travel distance genotype, p = 0.26; time, p < 0.001; bout distance genotype, p = 0.062; time, p < 0.001; bout frequency genotype, p = 0.55; time, p < 0.001; the relative time larvae spent in the central zone genotype, p = 0.001; time, p < 0.001. grin2Ab−/− versus grin2A+/+, travel distance genotype, p < 0.001; time, p < 0.001; bout distance genotype, p = 0.051; time, p = 0.003; bout frequency genotype, p < 0.001; time, p < 0.001; the relative time larvae spent in the central zone genotype, p < 0.001; time, p = 0.001. grin2A−/− versus grin2A+/+, travel distance genotype, p < 0.001; time, p < 0.001; bout distance genotype, p = 0.50; time, p < 0.001; bout frequency genotype, p < 0.001; time, p < 0.001; and the relative time larvae spent in the central zone genotype, p = 0.10; time, p < 0.001.