
Fig. 4
- ID
- ZDB-IMAGE-250902-75
- Publication
- Abramova et al., 2025 - Disruption of grin2A, an epilepsy-associated gene, produces altered spontaneous swim behavior in zebrafish
- All Figures
- Figures for Abramova et al., 2025
|
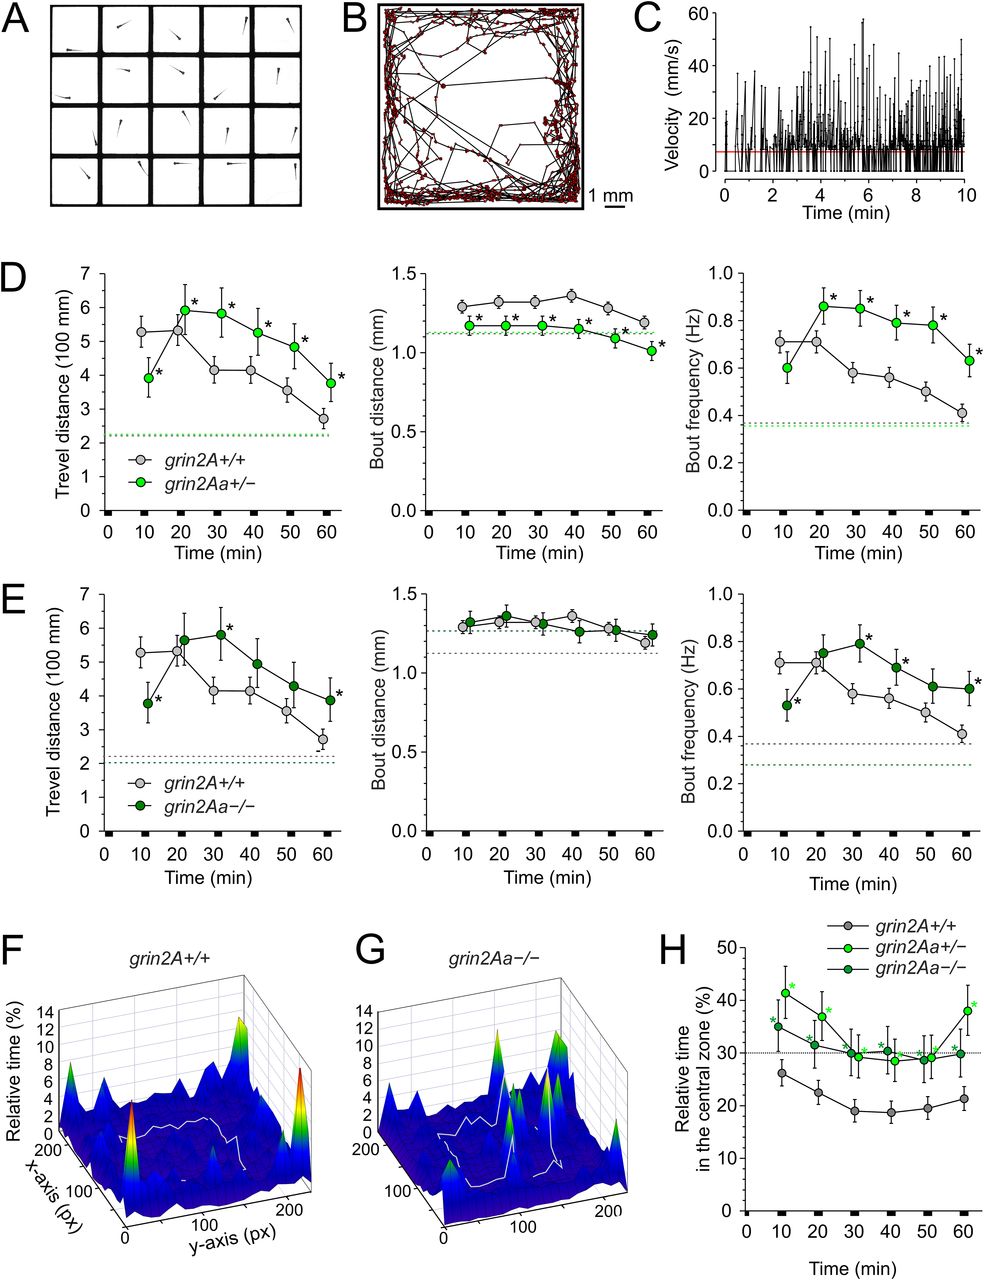
Fig. 4 Effects of grin2Aa deletion on larval swimming behavior and thigmotaxis. A, Photograph of a multiwell chamber used to simultaneously assess the spontaneous swimming behavior of 20 larvae (6 dpf). Larvae in the experiment were progeny of grin2Aa+/− intercrosses with the genotype determined after the behavioral experiment. B, The graph shows the sample trajectory of a grin2Aa+/+ larva as assessed during the first 10 min interval. Data points were acquired at 50 Hz. C, The graph shows the velocity of a grin2A+/+ larva assessed at 20 ms intervals. The red line indicates the velocity threshold for locomotor activity detection (see Materials and Methods). The MTD, MBD, and MBF of grin2Aa+/− and grin2A+/+ larvae (D) and grin2Aa−/− and grin2A+/+ larvae (E) are compared. Dashed lines correspond to mean values of the measured parameters at steady state, 2–3 h after the placement of larvae into the experimental chamber. For steady-state swimming parameters assessed 2–3 h after the larvae were placed in the experimental chambers, see Extended Data Figure 4-1. Representative heat maps for the relative time spent by grin2A+/+ (F) and grin2Aa−/− (G) larvae in 0.454 × 0.454 mm area bins (10 × 10 pixels) over 20 min of recording (30–50 min), indicated by color coding. The central zone (5.5 × 5.5 mm) used to assess thigmotaxis is outlined by a gray line. H, Comparison of thigmotaxis measured as the relative time spent by grin2A+/+, grin2Aa+/−, and grin2Aa−/− larvae in the central zone. The analysis was performed on the same larvae used to study locomotion. The dotted line indicates the level of randomness (30%). Data are expressed as mean ± 95% confidence interval of travel distance, bout distance, and bout frequency (D, E), and the relative time spent by larvae in the central zone (H) in episodes lasting 10 min; * indicates significant differences in genotype as assessed by ANOVA followed by the LSD post hoc test (grin2A+/+, n = 582; grin2Aa+/−, n = 429; grin2Aa−/−, n = 216). grin2Aa+/− versus grin2A+/+, travel distance genotype, p < 0.001; time, p < 0.001; bout distance genotype, p < 0.001; time, p < 0.001; bout frequency, genotype, p < 0.001; time, p < 0.001; and relative time larvae spent in the central zone genotype, p < 0.001; time, p < 0.001. grin2Aa−/− versus grin2A+/+, travel distance genotype, p = 0.0056; time, p < 0.001; bout distance genotype, p = 0.81; time p = 0.013; bout frequency, genotype, p = 0.001; time, p < 0.001; and relative time spent by larvae in the central zone genotype, p < 0.001; time, p = 0.013.