Figure Caption
Figure 8
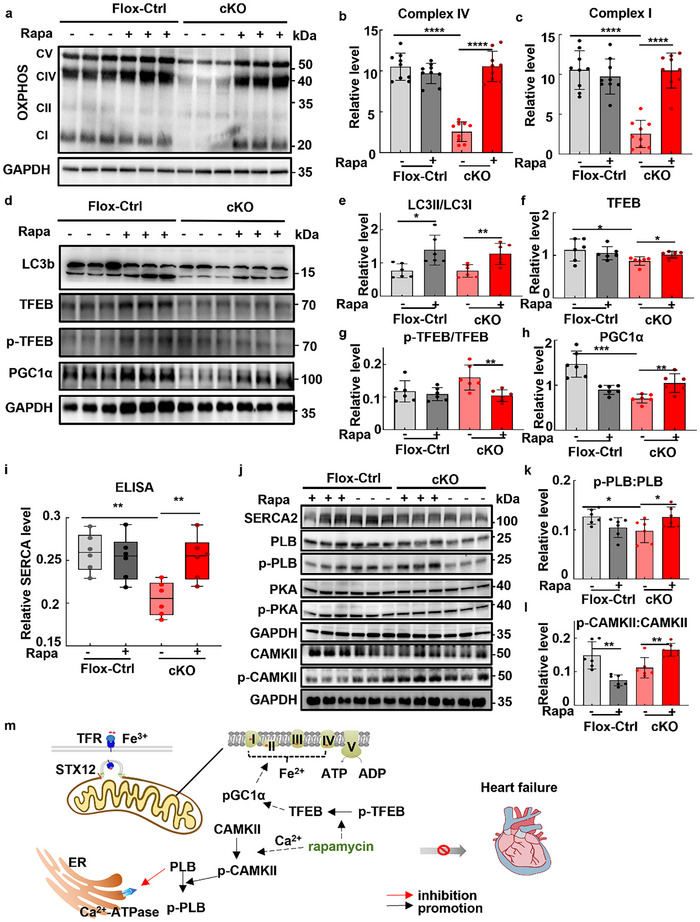
Rapamycin treatment enhanced mitochondrial protein synthesis and SERCA2 activity. a) Changes in the expressions of oxidative phosphorylation complexes (OXPHOS) in control (Stx12‐flox) and Stx12‐cKO mice after rapamycin or vehicle intervention, with GAPDH as the loading control. b) Quantification of Western blot of complex IV (Flox‐control + vehicle, n = 9; Flox‐control + rapamycin, n = 9; cKO + vehicle, n = 9; cKO + rapamycin, n = 9; Flox‐control + vehicle and cKO + vehicle, p < 0.0001; cKO + vehicle and cKO + rapamycin, p < 0.0001). c) Quantification of Western blot of complex I (Flox‐control + vehicle, n = 9; Flox‐control + rapamycin, n = 9; cKO + vehicle, n = 9; cKO + rapamycin, n = 9; Flox‐control + vehicle and cKO + vehicle, p < 0.0001; cKO + vehicle and cKO + rapamycin, p < 0.0001). d) Changes in the expressions of LC3b, TFEB, and its phosphorylated form as well as PGC1α in control (Stx12‐flox) and Stx12‐cKO mice after rapamycin or vehicle intervention, with GAPDH as the loading control. e) Quantification of Western blot of LC3II to LC3I ratio (Flox‐control + vehicle, n = 6; Flox‐control + rapamycin, n = 6; cKO + vehicle, n = 6; cKO + rapamycin, n = 6; Flox‐control + vehicle and Flox‐control + rapamycin, p = 0.0116; cKO + vehicle and cKO + rapamycin, p = 0.0068). f) Quantification of Western blot of TFEB (Flox‐control + vehicle, n = 6; Flox‐control + rapamycin, n = 6; cKO + vehicle, n = 6; cKO + rapamycin, n = 6; Flox‐control + vehicle and cKO + vehicle, p = 0.0463; cKO + vehicle and cKO + rapamycin, p = 0.0149). g) Quantification of Western blot of phosphorylated TFEB (Flox‐control + vehicle, n = 6; Flox‐control + rapamycin, n = 6; cKO + vehicle, n = 6; cKO + rapamycin, n = 6; cKO + vehicle and cKO + rapamycin, p = 0.0092). h) Quantification of Western blot of PGC1α (Flox‐control + vehicle, n = 6; Flox‐control + rapamycin, n = 6; cKO + vehicle, n = 6; cKO + rapamycin, n = 6; Flox‐control + vehicle and cKO + vehicle, p = 0.0001; cKO + vehicle and cKO + rapamycin, p = 0.0044). i) ELISA analysis of SERCA level in Stx12‐CKO (Stx12flox/flox with CTnT‐Cre) and control (Stx12flox/flox) mice after rapamycin or vehicle injection (Flox‐control + vehicle, n = 6; control + rapamycin, n = 6; cKO + vehicle, n = 6; cKO + rapamycin, n = 6; Flox‐control + vehicle and cKO + vehicle, p = 0.0012; cKO + vehicle and cKO + rapamycin, p = 0.0048). j) Western blot analysis of sarcoplasmic reticulum Ca2+ ATPase SERCA2, phospholamban (PLB) and its phosphorylated form, PKA and its phosphorylated form, as well as CAMKII and its phosphorylated form in control (Stx12‐flox) and Stx12‐cKO mice after rapamycin or vehicle intervention, with GAPDH as the loading control. k) Quantification of Western blot of phosphorylated phospholamban (Flox‐control + vehicle, n = 6; Flox‐control + rapamycin, n = 6; cKO + vehicle, n = 6; cKO + rapamycin, n = 6; Flox‐control + vehicle and cKO + vehicle, p = 0.0011; cKO + vehicle and cKO + rapamycin, p = 0.0019). l) Quantification of Western blot of phosphorylated CAMKII (Flox‐control + vehicle, n = 6; Flox‐control + rapamycin, n = 6; cKO + vehicle, n = 6; cKO + rapamycin, n = 6; Flox‐control + vehicle and Flox‐control + rapamycin, p = 0.0020; cKO + vehicle and cKO + rapamycin, p = 0.0042). m) A schematic shows that STX12 is involved in iron transportation and respiration complex assembly. Rapamycin treatment can enhance both mitochondrial protein biosynthesis and SERCA2 activity, ultimately contributing to the amelioration of heart failure in Stx12‐cKO mice. Statistical results: *p < 0.05, **p < 0.01, ***p < 0.001, ****p < 0.0001; t‐test.
Acknowledgments
This image is the copyrighted work of the attributed author or publisher, and
ZFIN has permission only to display this image to its users.
Additional permissions should be obtained from the applicable author or publisher of the image.
Full text @ Adv Sci (Weinh)