IMAGE

Figure 6

ID
ZDB-IMAGE-250828-181
Source
Figures for Yang et al., 2025
Image
Figure Caption

Figure 6

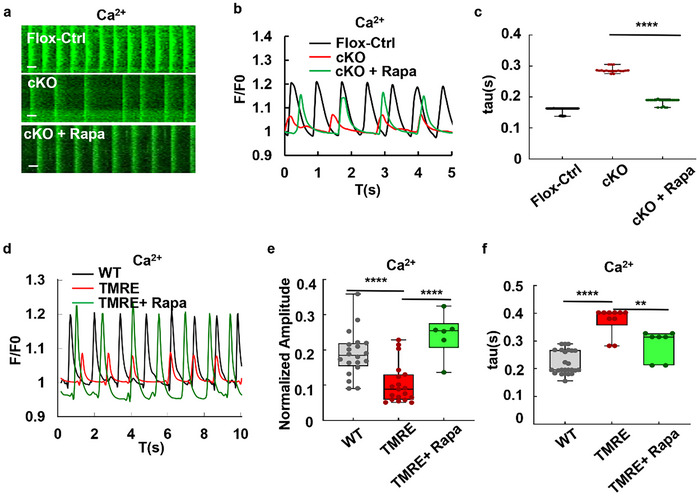
Rapamycin alleviated abnormal electrophysiology in Stx12‐cKO or energy‐deficient cardiomyocytes. a) Kymograph of Ca2+ dynamics in cultured control (Stx12flox/flox) cardiomyocytes, Stx12‐cKO (Stx12flox/flox with CTnT‐Cre) cardiomyocytes and Stx12‐cKO cardiomyocytes with rapamycin treatment. Time scale bars, 0.5 s. b) Calcium dynamical curves of control and Stx12‐cKO mouse cardiomyocytes cultured in vitro, before and after rapamycin administration. c) Decay constant of Ca2+ in Stx12‐CKO cardiomyocytes before and after rapamycin treatment. The decay constant of Ca2+ dynamics significantly decreased after rapamycin treatment (Flox‐control, n = 55 curves; CKO, n = 19 curves; cKO, rapamycin, n = 23 curves; p < 0.0001). d) Calcium dynamical curves of wild‐type cardiomyocytes in vitro with or without TMRE or rapamycin treatment (WT: black, TMRE: red, TMRE + rapamycin: green). e) Comparison of Ca2+ amplitudes in cardiomyocytes after TMRE and rapamycin treatment. The calcium amplitude was significantly reduced after TMRE treatment, and increased after rapamycin treatment (WT, n = 20; TMRE, n = 19, < 0.0001; TMRE + rapamycin, n = 6, p < 0.0001). f) The decaying constant τ of Ca2+ in cardiomyocytes with or without TMRE or rapamycin treatment. Tau was significantly increased after TMRE treatment, and decreased after rapamycin treatment (WT, n = 16; TMRE, n = 10, p < 0.0001; TMRE + rapamycin, n = 7, = 0.004). Statistical results: **p < 0.01, ****p < 0.0001; t‐test.

Acknowledgments
This image is the copyrighted work of the attributed author or publisher, and ZFIN has permission only to display this image to its users. Additional permissions should be obtained from the applicable author or publisher of the image. Full text @ Adv Sci (Weinh)