IMAGE

Figure 4

ID
ZDB-IMAGE-250828-179
Source
Figures for Yang et al., 2025
Image
Figure Caption

Figure 4

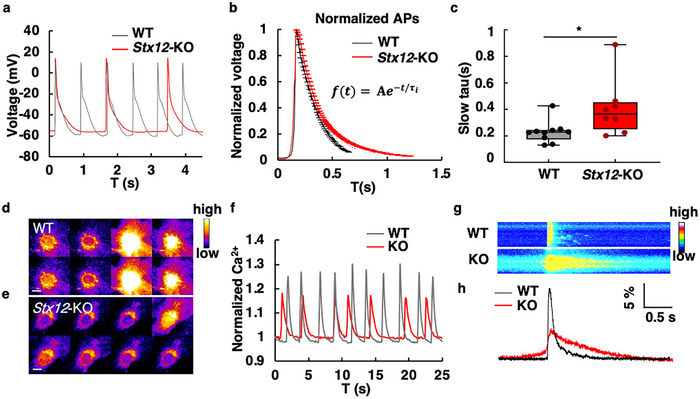
Abnormal electrophysiology of STX12 deficient cardiomyocytes. a) Patch‐clamp recordings of cardiomyocytes were primarily cultured from wild‐type (gray) and Stx12‐KO (red) mice. b) Normalized average action potential curves of wild‐type and Stx12‐KO mouse cardiomyocytes. The repolarization period was fitted with a single exponential decay curve (dashed line) (WT, black, 1361 action potentials of 9 cells; KO, red, 456 action potentials of 8 cells), and the decay constant (τ) was obtained from the fitted results. c) Comparison of the τ of the action potential curves (WT, black, n = 10 cells; KO, red, n = 8 cells, t‐test, p = 0.0272). d,e) Calcium imaging of wild‐type (d) and Stx12‐KO (e) mouse cardiomyocytes cultured in vitro. Images were represented as pseudo‐color, scale bars, 5 µm. The time interval between two images was 0.18 s. f) Calcium dynamics of wild‐type and Stx12‐KO mouse cardiomyocytes cultured in vitro. g) Representative calcium kymograph of single Ca2+ spike of wild‐type cardiomyocyte (upper) and Stx12‐KO (lower) cardiomyocyte. Images were represented as pseudo‐color. h) Calcium dynamical curve of single Ca2+ spike in (g). Compared to wild type, the peak value of stx12‐KO calcium concentration decreased while the decay phase time was prolonged. Statistical results: *p < 0.05; t‐test.

Acknowledgments
This image is the copyrighted work of the attributed author or publisher, and ZFIN has permission only to display this image to its users. Additional permissions should be obtained from the applicable author or publisher of the image. Full text @ Adv Sci (Weinh)