
Image
|
Figure Caption
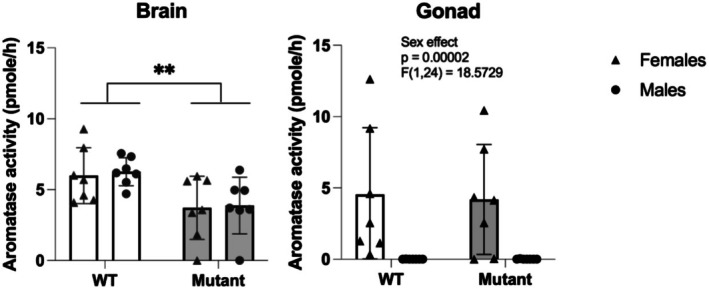
FIGURE 2
Aromatase activity expressed in pmole per hour in the brain and the gonad of WT and mutant adult zebrafish, in males and females.
Acknowledgments
This image is the copyrighted work of the attributed author or publisher, and
ZFIN has permission only to display this image to its users.
Additional permissions should be obtained from the applicable author or publisher of the image.
Full text @ J. Neurochem.