
Image
|
Figure Caption
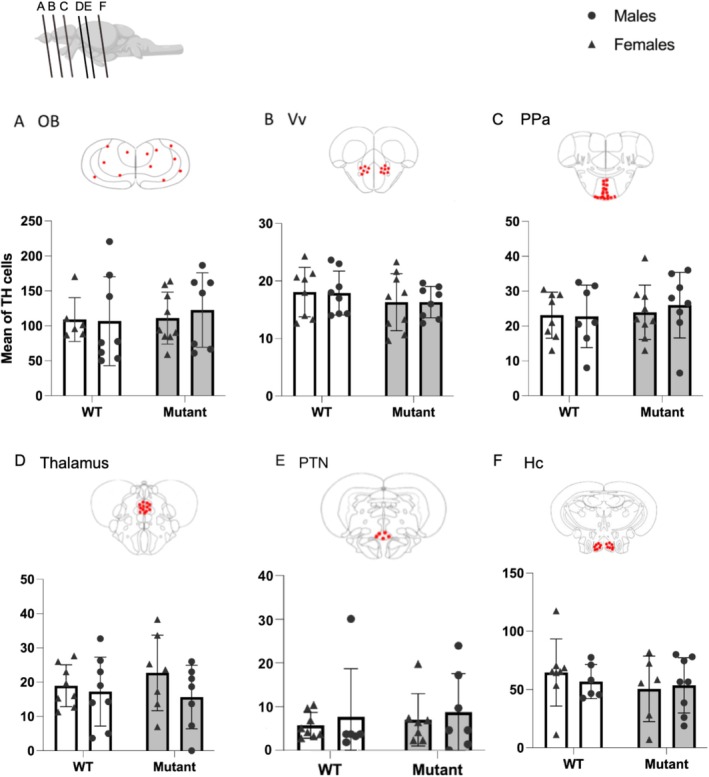
FIGURE 5
Quantification of TH‐positive cells in WT and mutant fish. (A) Olfactory bulbs (OB). (B) Ventral nucleus of ventral telencephalic area (Vv). (C) Parvocellular preoptic nucleus (PPa). (D) Thalamus. (E) Posterior tuberal nucleus (PTN). (F) Caudal zone of periventricular hypothalamus (Hc). Red plots represent regions of interest in which TH‐positive cells have been quantified. Mean ± SEM; the number of analyzed brains is indicated in each bar.
Acknowledgments
This image is the copyrighted work of the attributed author or publisher, and
ZFIN has permission only to display this image to its users.
Additional permissions should be obtained from the applicable author or publisher of the image.
Full text @ J. Neurochem.