
|
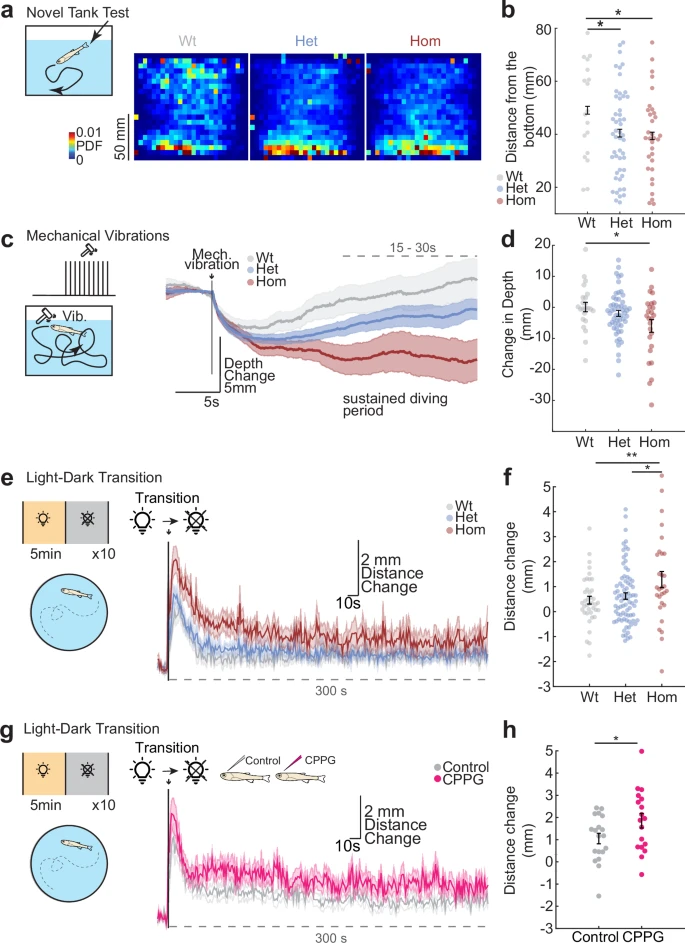
Fig. 7 Genetic perturbation of mGluR6a enhances sustained defensive behaviors in juvenile zebrafish. a Novel vertical tank diving test of free-swimming in wildtype (Wt, grey), heterozygous (Het, blue), homozygous (Hom, red) mGluR6a mutant zebrafish. Average probability density (PDF) of the fish position, during the first 2 minute in the novel tank. Warmer colors mean higher probability. b Distance from the bottom (mm) during the first 2 min. Note that Het and Hom are significantly closer to the bottom when compared to Wt fish (Wt n = 18 fish, Het n = 50 fish, Hom n = 32 fish, Wt vs Het *p = 0.0405, Wt vs Hom *p = 0.0337, Het vs Hom is n.s., one-sided Wilcoxon rank sum test). c Mechanical vibrations are delivered to free-swimming juvenile zebrafish (vertical tank). Average diving depths evoked by mechanical vibrations. Dashed line indicates the sustained period used for statistical comparisons in (d). d Sustained diving depth following mechanical vibrations is shown for the three groups. Homozygous mGluR6a mutants dive significantly deeper (Wt n = 23 fish, Het n = 54 fish, Hom n = 26 fish. Wt vs Het p is n.s., Wt vs Hom *p = 0.0231, Het vs Hom is n.s., one-sided Wilcoxon rank sum test). e, g Sustained increase in free swimming speed evoked by Light-Dark transition (horizontal tank). Average swimming distances (mm) are plotted for mGluR6a mutant Hom: red, Het: blue, Wt: grey in (e) and for 5 mM CPPG- (pink) and control-(grey) injected juvenile fish. Arrow indicate the light to dark transition. Dashed lines indicate the sustained increase in swimming rate evoked by light-dark transition used for statistics in (f) and (h). f Homozygous mGluR6a mutants swim significantly more (mm) upon light and dark transition (Wt n = 39 fish, Het n = 80 fish, Hom n = 29 fish Wt vs Het p is n.s., Wt vs Hom **p = 0.0068, Het vs Hom *p = 0.0178., one-sided Wilcoxon rank sum test). h CPPG-injected fish swim significantly more (mm) upon light and dark transition (Control n = 19 fish, CPPG n = 18 fish, *p = 0.0288, one-sided Wilcoxon rank sum test). Shadow indicates +/-SEM. Error bars represent mean +/-SEM. Scattered dots represent individual fish. See also Supplementary Fig. 9 for imaging data of the mGluR6a mutant and Supplementary Fig. 10 for more behavior of the CPPG-injected fish. Source data are provided as a Source Data file