
|
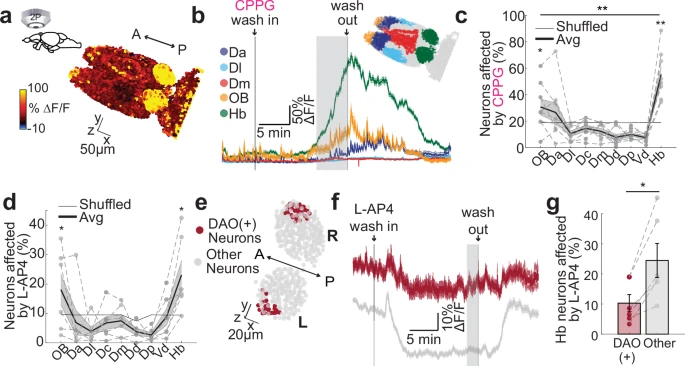
Fig. 3 Pharmacological targeting of group III mGluRs can specifically activate and inhibit zebrafish dorsal habenula and the olfactory bulbs. a 3D reconstructions of calcium signals ( F/F) from representative juvenile Tg(elavl3:GCaMP6s-nuclear) zebrafish forebrain in response to bath application of group III mGluR antagonist CPPG (300 M). Warm colors represent stronger activation. b Average time courses of calcium signals from anatomically identified forebrain regions (Dorso-anterior (Da): blue, Dorso-lateral (Dl): cyan, Dorso-medial (Dm): red, olfactory bulb (OB): yellow, habenula (Hb): green) in response to CPPG application. Lines indicate the wash in and out, grey area shows the period used to calculate affected neurons in c. Shadow represents +/-SEM. Delineated forebrain regions are color-coded. c, d Percentage of neurons in anatomically identified forebrain regions that are affected by CPPG (c) or L-AP4 (0.1 M) (d). Affected means that neuronal calcium signals were 2STD above or below the baseline during 5 min drug period (shaded grey in B or F). Scatters corresponding to individual fish are connected with dashed lines. The thick black line is the mean; shadow presents SEM. Grey line represents the shuffle distribution. Neurons in the olfactory bulb and the habenula are significantly more affected above chance levels (CPPG n = 8 fish, OB *p = 0.0391, Hb **p = 0.0039; L-AP4 n = 6 fish, OB *p = 0.0469, Hb *p = 0.0156, rest is n.s., one-sided Wilcoxon signed-rank test). Habenula neurons show significantly stronger CPPG responses than olfactory bulb (**p = 0.0039, one-sided Wilcoxon signed-rank test). Dc:dorso-central, Dp:dorso-posterior, Vd:ventral-dorsal. e Zebrafish habenula expressing Tg(dao:GAL4VP16; UAS-E1b:NTR-mCherry) and Tg(eval3:GCaMP6-nuclear). Dao-positive ventral habenula neurons are indicated in dark red. f Average time courses of calcium signals of dao-positive neurons from example habenula in “e” (dark red) and the other habenula neurons (grey). Wash in and out of L-AP4 is indicated by grey lines. The grey area indicated the period for affected cell calculation. Shadow represents SEM. g Significantly smaller fraction of dao-positive (DAO(+)) ventral habenula neurons are inhibited by the application of group III mGluR agonist L-AP4, when compared to the rest of habenular neurons (n = 6 fish, *p = 0.0156, one-sided Wilcoxon signed-rank test). Scatters corresponding to individual fish are connected with dashed lines. L left, R right, A anterior, P posterior. Scale bar represents 50 (a) and 20 m (e). Error bars: mean +/- SEM. See also Supplementary Fig. 3. Source data are provided as a Source Data file.