
|
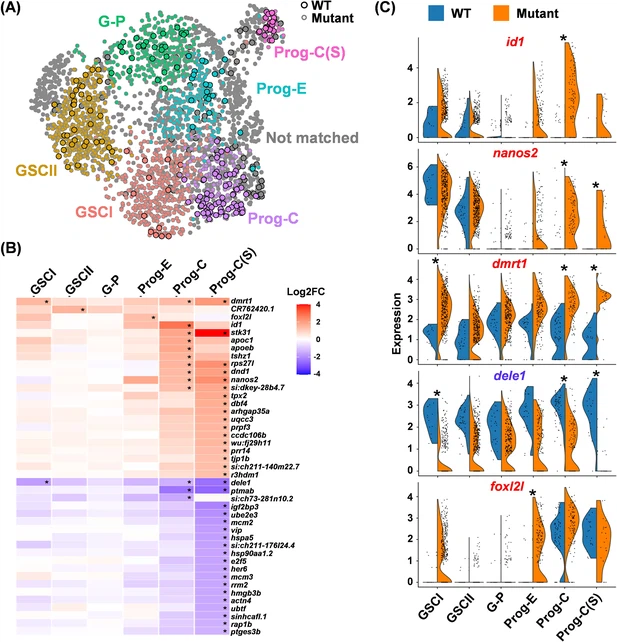
Fig. 4 Identification of differentially expressed genes (DEGs) in wild-type (WT) and foxl2l mutants. (A) Uniform Manifold Approximation and Projection (UMAP) visualization of integrated cells, with six matched stages of WT and mutant cells displayed in different colors. Unmatched cells are labeled in gray. Circles with a black outline: WT cells. Circles with gray outline: mutant cells. (B) Heatmap showing the fold change (FC) between the mutant versus WT (mutant/WT) for all DEGs at each stage. Developmental stages are displayed on the X-axis, and gene names are displayed on the Y-axis. (C) Split-violin plots showing the distribution of cells expressing top DEGs at different development stages (X-axis) between WT and mutant. Asterisks in (B) and (C) indicate significant differences in gene expression between WT and mutants.