
|
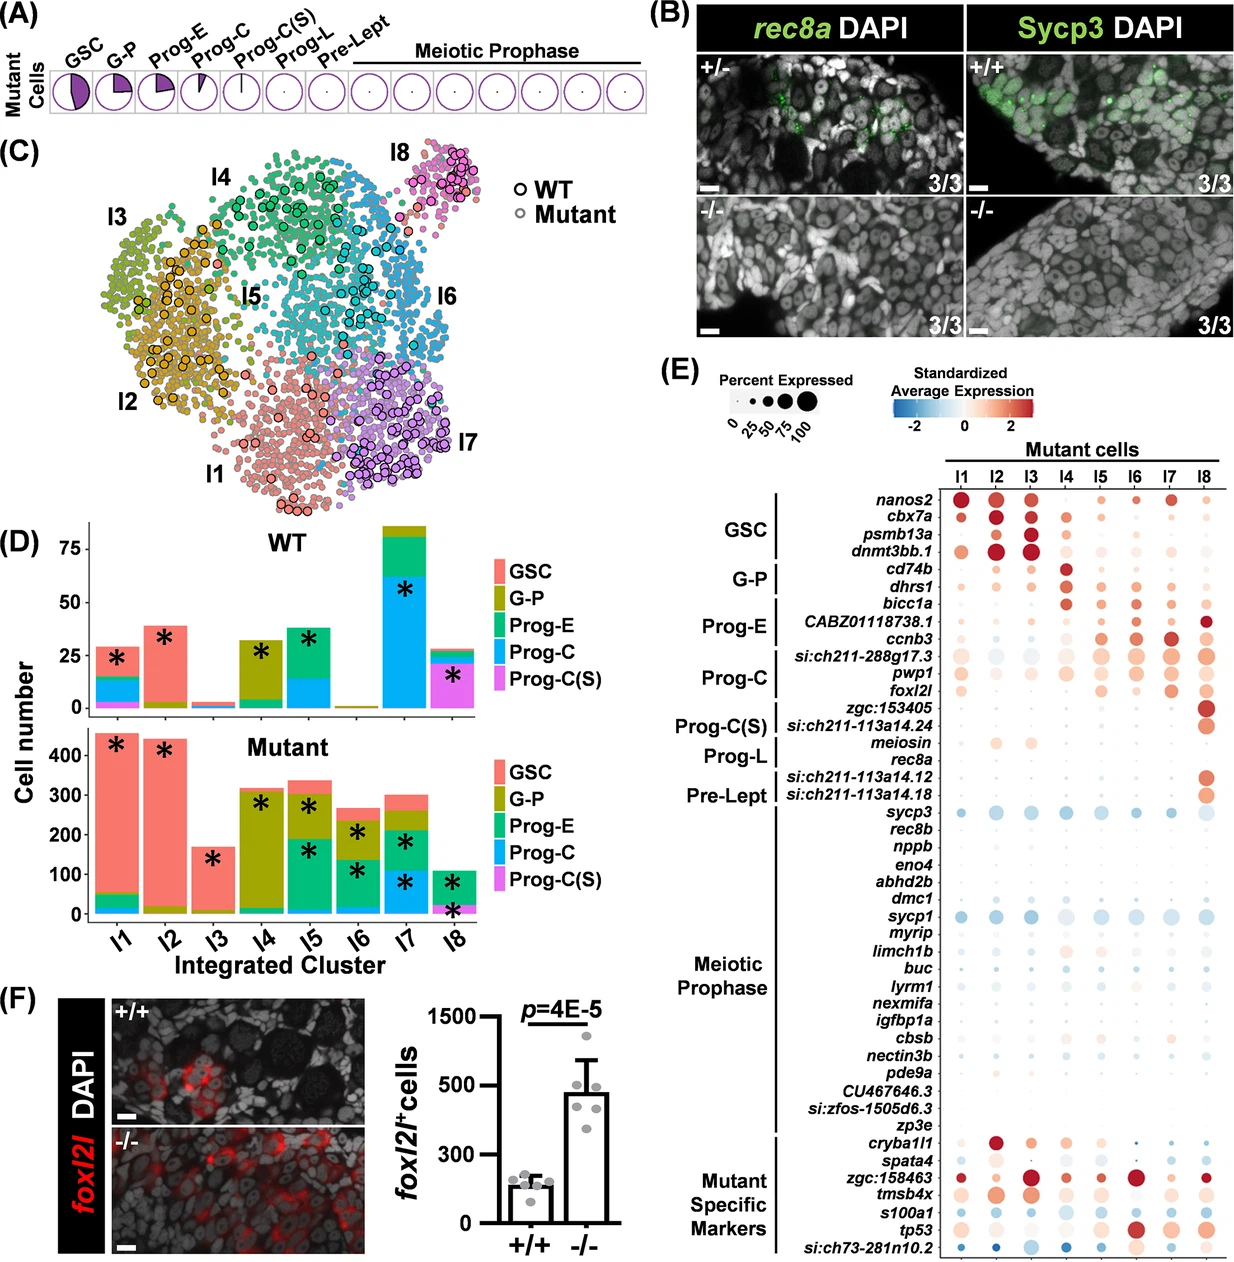
Fig. 3 Germ cells in foxl2l mutants are arrested at the stage of committed progenitor with aberrant gene expression. (A) Pie charts showing the proportion of mutant cells classified into different developmental stages. (B) Absence of the Prog-L marker rec8a and meiotic marker Sycp3 in foxl2l mutant gonads. (Left) RNA fluorescence in situ hybridization (FISH) and (right) immunofluorescence staining of wild-type (WT) (+/+), foxl2l+/10i (+/-), and foxl2l10i/10i (-/-) gonads at 28 days post fertilization (dpf) (left) and 21 dpf (right), respectively. The numbers at the bottom right corner indicate that all three gonads in each genotype have the same staining pattern. Scale bars represent 10 µm. (C) Uniform Manifold Approximation and Projection (UMAP) visualization of integrated cells grouped into eight clusters. Circles with black outline: WT cell. Circles with gray outline: mutant cell. (D) Bar graphs showing the proportions of developmental stages for WT and mutant cells in each integrated group. Prominent stages with statistical significance were marked by asterisks (*). (E) Dot plot showing the expression of marker genes (Y-axis) in the mutant cells across integrated groups (X-axis). (F) foxl2l10i/10i (-/-) gonads contain an increased number of foxl2l+ cells at 26 dpf. Left: in situ hybridization of the gonads with foxl2l. Right: quantification of the staining data. One dot in the graph represents one gonad, n=6 in each genotype.