
|
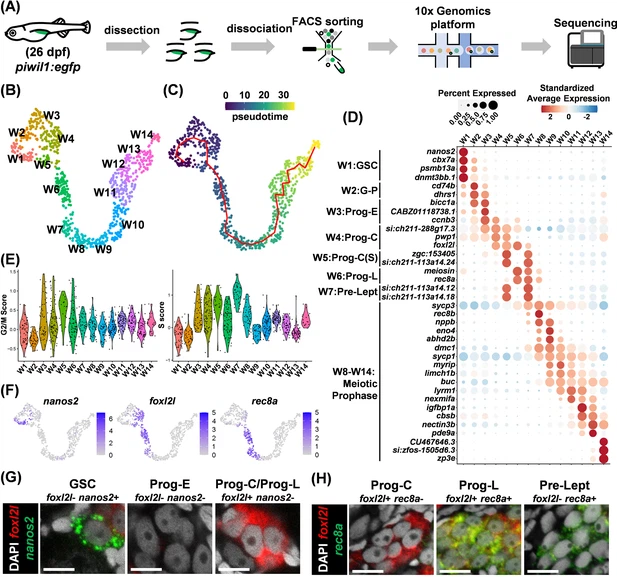
Fig. 1 Single-cell transcriptome landscape of zebrafish germ cell development. (A) Flowchart for sample collection and RNA sequencing. (B) Uniform Manifold Approximation and Projection (UMAP) visualization of wild-type (WT) germ cells in 14 clusters. (C) Pseudotime shown by the color bar and the trajectory shown by a red line. (D) Dot plot showing the expression of top marker genes for each cluster. (E) Violin plots displaying S and G2/M cell-cycle scores for each cluster. (F) UMAP visualization of marker gene expression for nanos2, foxl2l, and rec8a. (G,H) Identification of germ cell types by RNA fluorescent in situ hybridization (FISH) of marker genes, nanos2 and foxl2l in (G), rec8a and foxl2l in (H), in 26 days post fertilization (dpf) gonads. Scale bar: 10 µm.