IMAGE

Fig. 3

ID
ZDB-IMAGE-250814-16
Source
Figures for Aguilera-Correa et al., 2025
Image
Figure Caption

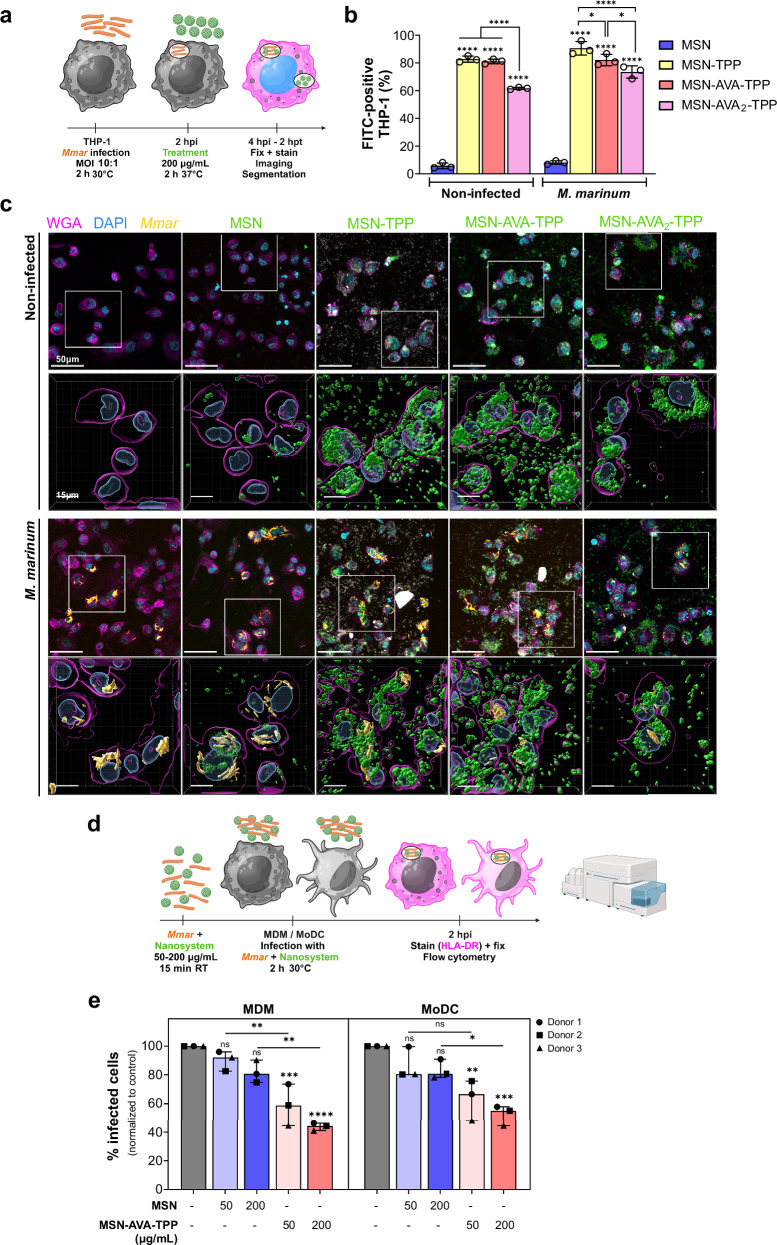
Fig. 3 Nanosystem affinity towards macrophages and effect on bacterial uptake.

a Schematic representation of the protocol used for the affinity assay. b Percentages of FITC-positive non-infected and Mmar-infected THP-1 cells after treatment with 200 µg/mL of each nanosystem for 2 h. The experiment was performed in 3 biological replicates and 3 technical replicates each. Data are shown as mean ± SD (n = 3). Comparisons were done using two-way ANOVA with Tukey’s multiple comparisons test. Asterisks above each bar correspond to comparison to MSN within the condition. Adjusted values (from left to right): Non-infected: ****p < 0.0001; M. marinum: ****p < 0.0001, *p = 0.0171 (TPP vs AVA-TPP), *p = 0.0152 (AVA-TPP vs AVA2-TPP). c Representative images of non-infected and Mmar-infected THP-1 cells after treatment with 200 µg/mL of each nanosystem. First and third line correspond to xy orthogonal projection of z-stack confocal images, with a more detailed 3D reconstruction (second and fourth line) of the white squares. Three independent experiments were performed. d Schematic representation of the protocol used for the internalization assay. e Percentage of infected monocyte-derivate macrophages (MDM) (left panel) and monocyte-derivate dendritic cells (MoDC) (right panel) measured by flow cytometry. Both cell types were infected with mScarlet-Mmar pre-incubated with control (gray), 50 or 200 µg/mL of MSN (blue), or MSN-AVA-TPP (orange). The experiment was performed with 3 donors, and 3 technical replicates for each donor. Each dot corresponds to the mean of 3 technical replicates for one donor, normalized to the control. Data are shown as median and interquartile range (n = 3). Comparisons were done using ordinary one-way ANOVA with Šídák’s multiple comparisons test. Asterisks above each bar correspond to comparison to non-treated condition (gray). Adjusted values (from left to right): MDM: ns p = 0.7783 (MSN 50), ns p = 0.1575 (MSN 200), ***p = 0.0008, ****p < 0.0001, **p = 0.0065 (MSN 50 vs AVA-TPP 50), **p = 0.0015 (MSN 200 vs AVA-TPP 200); MoDC: ns p = 0.5958 (MSN 50), ns p = 0.3277 (MSN 200), **p = 0.0049, ***p = 0.0006, ns p = 0.0814 (MSN 50 vs AVA-TPP 50), *p = 0.016 (MSN 200 vs AVA-TPP 200). Created in BioRender. Kremer, L. (2025) https://BioRender.com/1qn1m1o. Source data are provided as a SourceData file.

Acknowledgments
This image is the copyrighted work of the attributed author or publisher, and ZFIN has permission only to display this image to its users. Additional permissions should be obtained from the applicable author or publisher of the image. Full text @ Nat. Commun.