
Fig. 6
- ID
- ZDB-IMAGE-250813-27
- Publication
- Halford et al., 2025 - TMEM63A, associated with hypomyelinating leukodystrophies, is an evolutionarily conserved regulator of myelination
- All Figures
- Figures for Halford et al., 2025
|
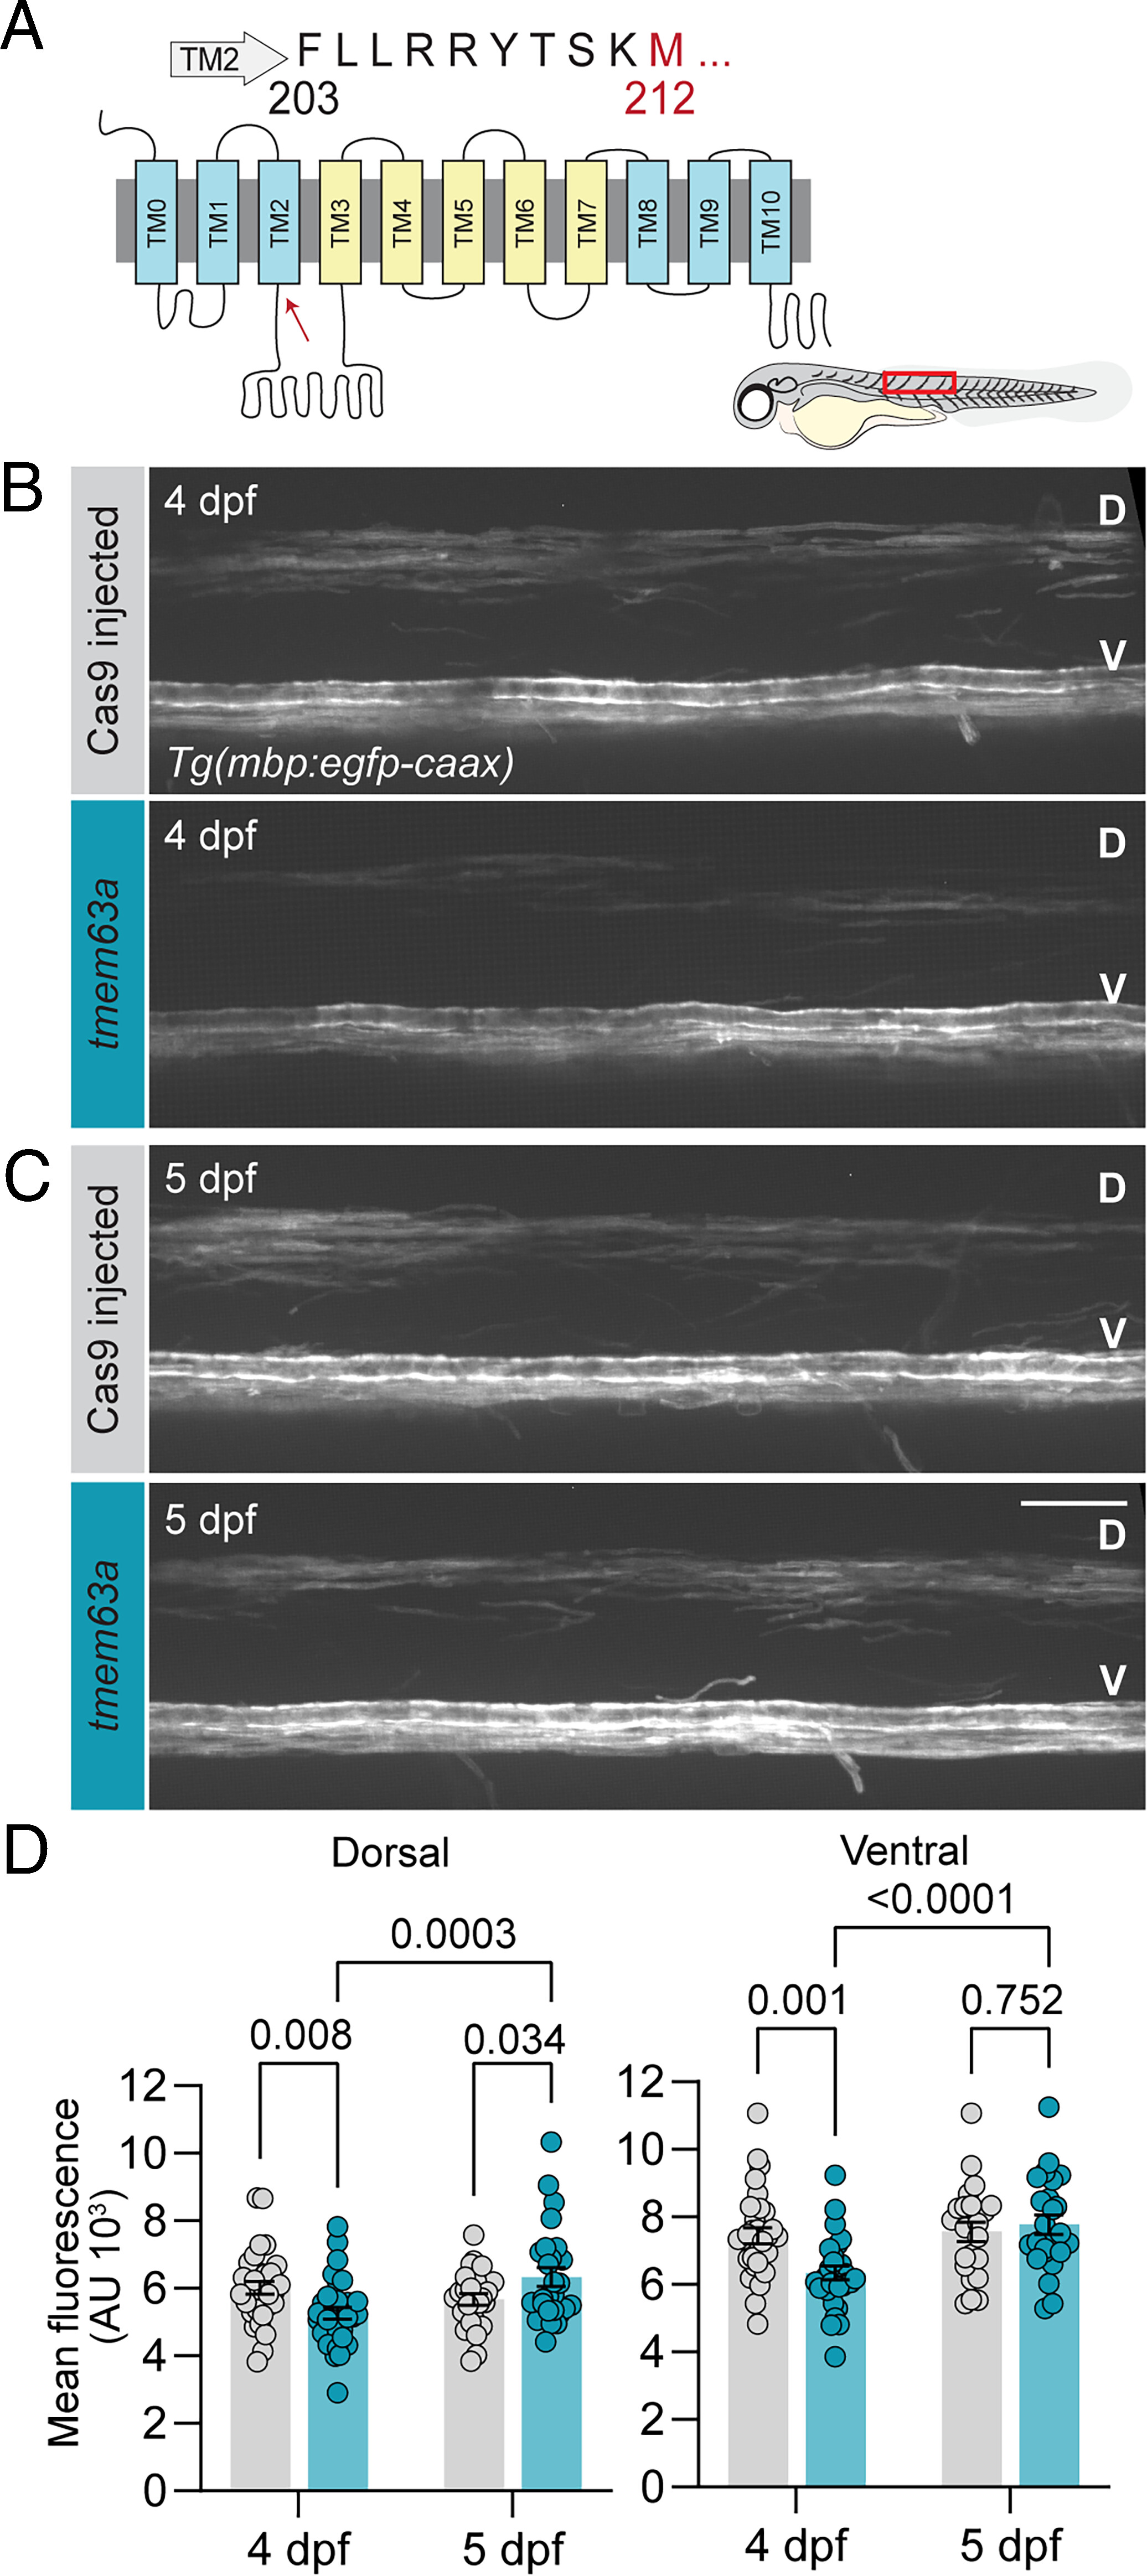
Fig. 6 TMEM63A function in myelination is conserved in zebrafish. (A) Topology map of Danio rerio Tmem63a; region targeted by CRISPR/Cas9 flanks M212 (highlighted in red and indicated by the red arrow on the map). Representative micrographs comparing control Cas9 injected or tmem63a sgRNAs injected in Tg(mbp:egfp-caax) fish at 4 dpf (B) and 5 dpf (C). D, dorsal and V, ventral spinal cord. Cartoon larva illustrates ROI (red box). (Scale bar, 25 µm.) (D) Mean mbp:egfp-caax intensity of dorsal (Left) and ventral (Right) spinal cord from z-stack sum projections of Cas9 and tmem63a F0 fish. (n = 25 to 32 animals per crispant and age, mixed effects analysis of multiple comparison by uncorrected Fisher’s LSD).