
Fig. 3
- ID
- ZDB-IMAGE-250813-24
- Publication
- Halford et al., 2025 - TMEM63A, associated with hypomyelinating leukodystrophies, is an evolutionarily conserved regulator of myelination
- All Figures
- Figures for Halford et al., 2025
|
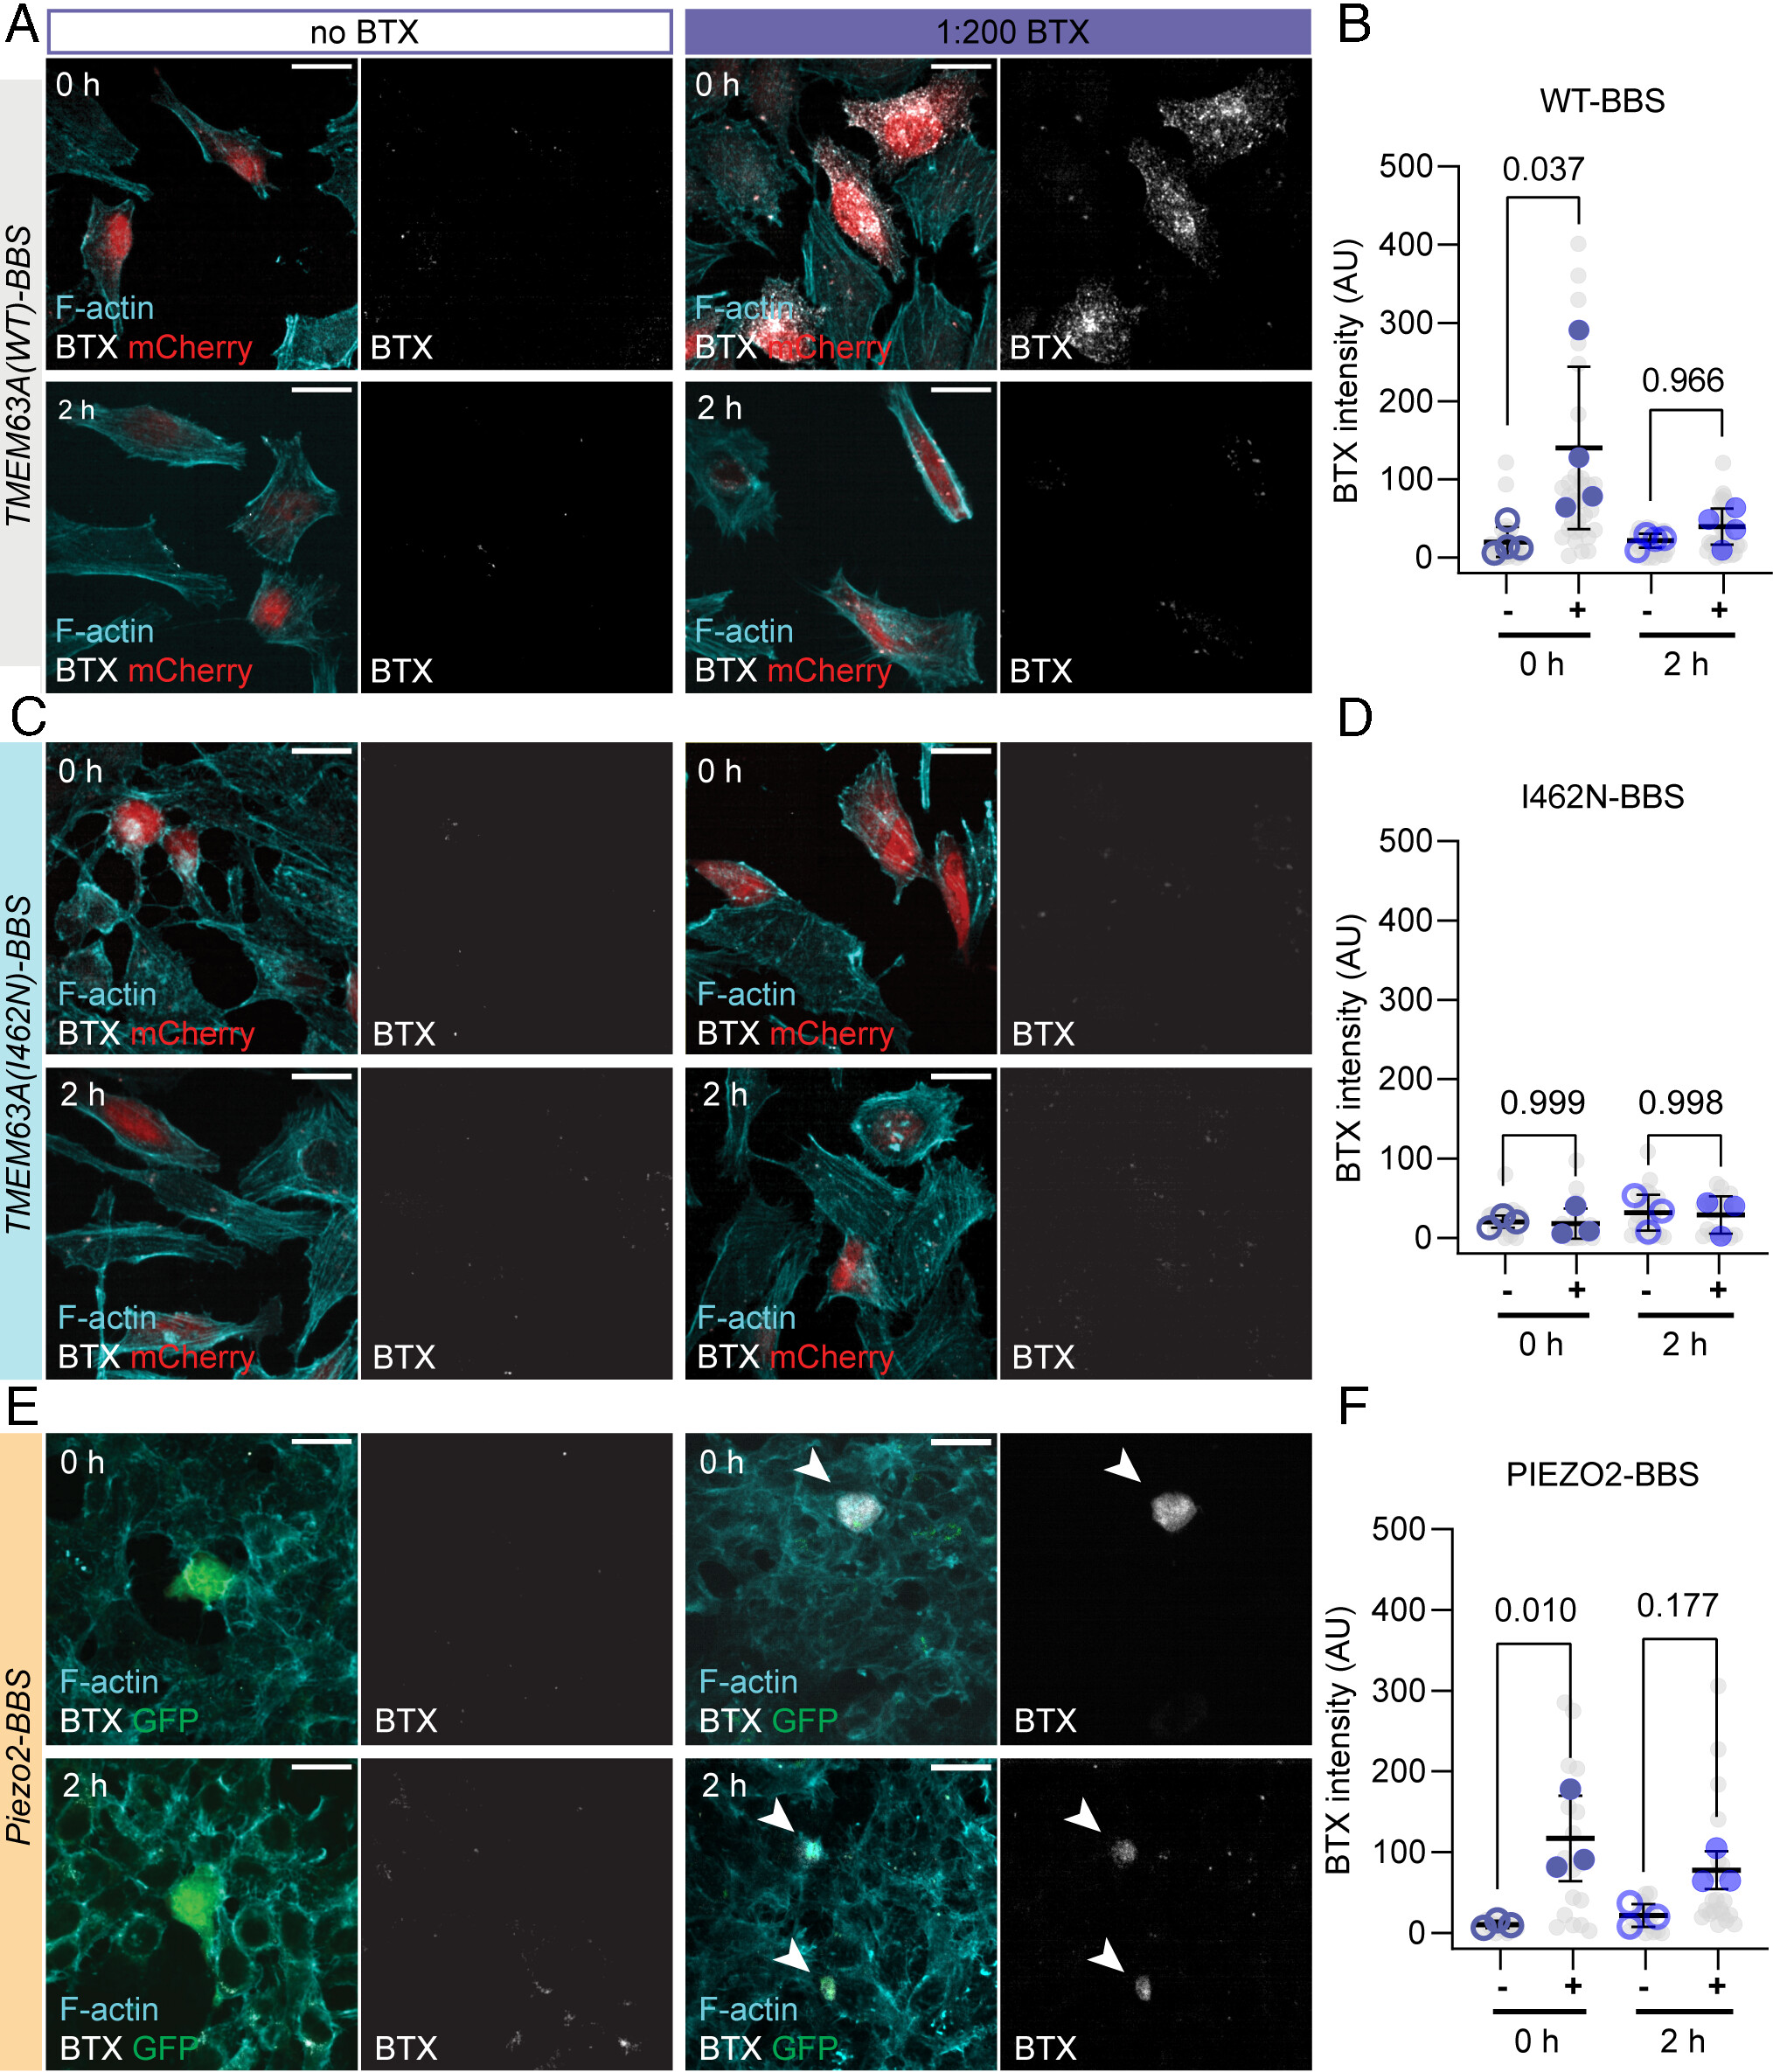
Fig. 3 TMEM63A is transiently localized to the plasma membrane. (A) Representative micrographs of HeLa-P1KO cells transfected with TMEM63A(WT)-BBS/IRES/mCherry prior to incubation with BTX-AF 647. Cells were fixed either immediately after (0 h) or 2 h after removal of BTX conjugate (2 h). BTX signal (grays), F-actin (cyan), and mCherry (red) are shown. (Scale bar, 20 µm.) (B) Quantification of BTX signal at 0 h and 2 h post labeling for conditions with (solid markers) or without (empty markers) conjugate for TMEM63A(WT)-BBS. Individual cells shown in gray, culture/transfection averages shown in blue (n = 4 transfections). (C) Representative micrographs of HeLa-P1KO cells transfected with TMEM63A(I462N)-BBS/IRES/mCherry prior to incubation with BTX-AF 647 conjugate, as in (A). (D) Quantification of BTX signal at 0 h and 2 h post labeling for conditions with (solid markers) or without (empty markers) conjugate, as in (B) (n = 3 transfections). (E) Representative micrographs of HEK-P1KO cells transfected with Piezo2-BBS/IRES/EGFP prior to incubation with BTX-AF 647 conjugate, as in (A). Arrowheads indicate transfected cells positive for BTX labeling. (F) Quantification of BTX signal at 0 h and 2 h post labeling for conditions with (solid markers) or without (empty markers), as in (B) (n = 3 transfections). Data in (B, D, and F) analyzed by one-way ANOVA followed by Tukey’s multiple comparison).