
|
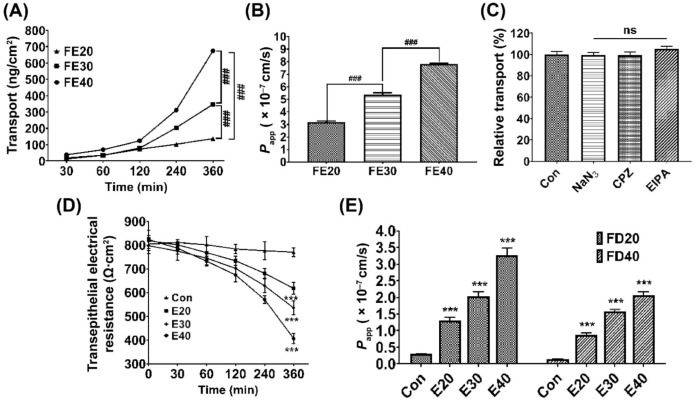
Fig. 7 Transport mode and behavior of EPF3 in Caco-2 cell monolayer model. (A) Effects of concentration and time on transport amounts (n = 5). (B) Effects of concentration and time on Papp of FEPF3 in AP-BL direction (n = 3). (C) Effects of various transport inhibitors on the relative transport of EPF3. EPF3 without transport inhibitor was considered to be 100% as Con group (n = 3). (D) The effect of EPF3 concentration and transport time on the transepithelial electrical resistance value (n = 6). (E) Effect of EPF3 on the permeability of FD20 and FD40 in the Caco-2 cell monolayer model (n = 4). Data were presented as mean ± standard deviation. ###P < 0.001, vs the FE20, FE30, or FE40 group. nsP > 0.05 and ***P < 0.001, vs the Con group. Con: control group; CPZ: group treated with 30 μmol/L chlorpromazine; E20: group treated with 20 μg/mL EPF3; E30: group treated with 30 μg/mL EPF3; E40: group treated with 40 μg/mL EPF3; EIPA: group treated with 100 μmol/L 5-(N,N-hexamethylene)-amiloride; EPF3: a fibrinolysin monomer isolated and purified from Pheretima vulgaris Chen; FD: fluorescein isothiocyanate-dextran; FD20: FD of molecular weight of 20 kDa; FD40: FD of molecular weight of 40 kDa; FE20: group treated with 20 μg/mL FEPF3; FE30: group treated with 30 μg/mL FEPF3; FE40: group treated with 40 μg/mL FEPF3; FEPF3: EPF3 marked with FD; NaN3: group treated with 1 mg/mL NaN3; Papp: apparent permeability coefficients.