
Image
|
Figure Caption
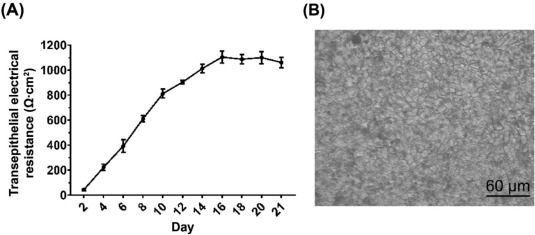
Fig. 5 Establishment of Caco-2 cell monolayer model. (A) Transepithelial electrical resistance value of Caco-2 cell monolayers with growth time. Data were presented as mean ± standard deviation (n = 6). (B) Morphological observation of the Caco-2 monolayers (200×).
Acknowledgments
This image is the copyrighted work of the attributed author or publisher, and
ZFIN has permission only to display this image to its users.
Additional permissions should be obtained from the applicable author or publisher of the image.
Full text @ J Integr Med