IMAGE

Fig. 1

ID
ZDB-IMAGE-250808-66
Source
Figures for Ostenrath et al., 2025
Image
Figure Caption

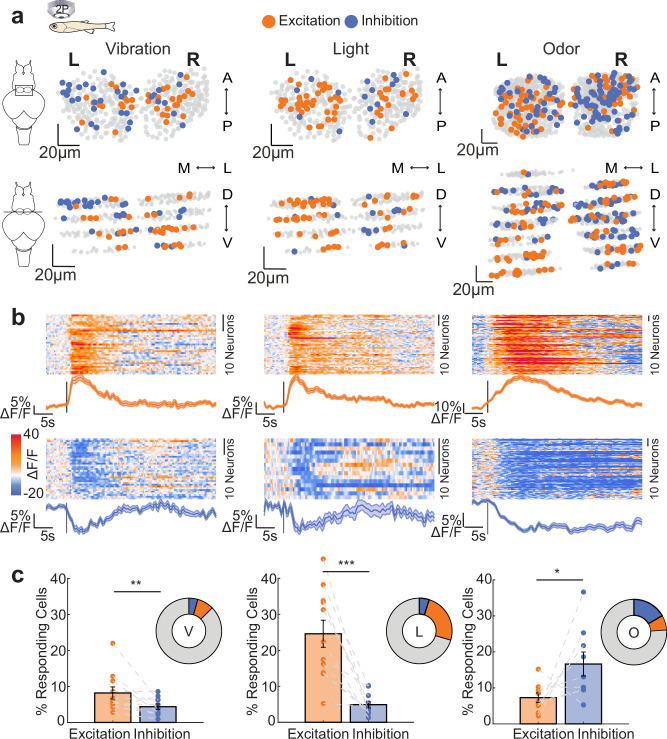
Fig. 1 Habenular neurons respond to vibration, light and odors with both excitation and inhibition.

a Representative examples showing the location of responding neurons in three-dimensional Hb reconstruction in Tg(elavl3:GCaMP6s) juvenile zebrafish in the dorsal-ventral view (top) and the coronial view (bottom). Neurons are color-coded by their response to vibration (left), light (middle) and odor (amino acid mixture, right). Neurons with activity 2 STD higher than baseline are orange (excitation), 1 STD smaller than baseline are blue (inhibition), non-responding neurons are grey. Scale bar represents 20 μm in x, y and z direction. L left, R right, A anterior, P posterior; D dorsal, V ventral, M-L medial to lateral. b Time-courses of habenular calcium signals (ΔF/F) of the excited (top) and inhibited (bottom) neurons from panel (a) to the vibration (left), light (middle) and odor (right) stimulations. In the heatmap warm colors indicate excitation, cold colors represent inhibition. Orange and blue colored lines represent average excitation and inhibition, respectively. Stimulus onset is indicated by the black line. Shadow represents +/- SEM. c Percentage of excited and inhibited habenular neurons upon vibration (left, n = 11 fish, **p = 0.0098), light (middle, n = 11 fish, ***p = 0.0005) and odor (right, n = 9 fish, *p = 0.0273) stimulations. (one-sided Wilcoxon signed-rank test). Error bar represents mean +/- SEM. Also, see Supplementary Fig. 1. Source data are provided as a Source Data file.

Acknowledgments
This image is the copyrighted work of the attributed author or publisher, and ZFIN has permission only to display this image to its users. Additional permissions should be obtained from the applicable author or publisher of the image. Full text @ Nat. Commun.