
|
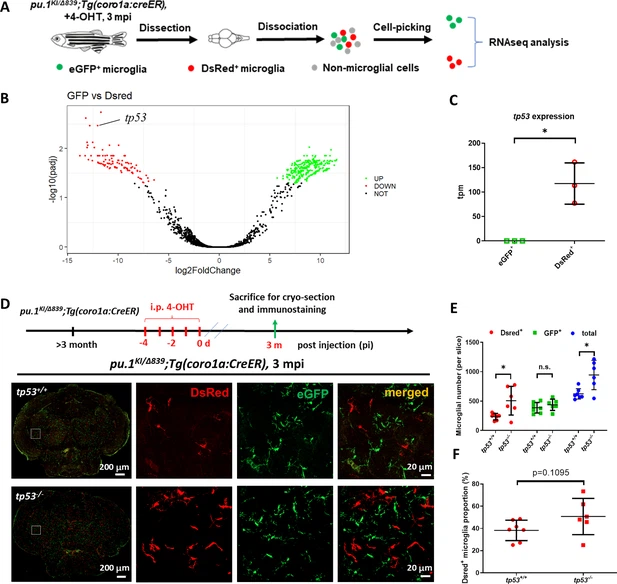
Fig. 5 Inactivation of Tp53 largely restored the number of pu.1-deficient microglia in mosaic condition. (A) The experimental setup for the isolation of eGFP+ and DsRed+ microglia from pu.1KI/Δ839;Tg(coro1a:CreER) adult brain at 3 mpi for transcriptomic analysis. (B) The volcano plot of differentially expressed genes (DEG) between eGFP+ and DsRed+ microglia at 3 mpi. (C) Relative expression of tp53 in eGFP+ (n=3) and DsRed+ (n=3) microglia at 3 mpi by transcripts per million (TPM). (D) The experimental setup for pu.1 conditional knockout in wild-type and tp53-/- adult zebrafish, and the representative images of midbrain cross section of pu.1KI/Δ839;Tg(coro1a:CreER) and pu.1KI/Δ839;tp53-/-;Tg(coro1a:CreER) fish at 3 mpi. (E) Quantification of the number of DsRed+, eGFP+, and total (DsRed + eGFP) microglia in pu.1KI/Δ839;Tg(coro1a:CreER) (n=7) and pu.1KI/Δ839;tp53-/-;Tg(coro1a:CreER) (n=6) fish at 3 mpi. (F) Quantification of the proportion of DsRed+ microglia in pu.1KI/Δ839;Tg(coro1a:CreER) (n=7) and pu.1KI/Δ839;tp53-/-;Tg(coro1a:CreER) (n=6) fish at 90 dpi. n.s.=not significant, p>0.05; *p<0.05.