
Image
|
Figure Caption
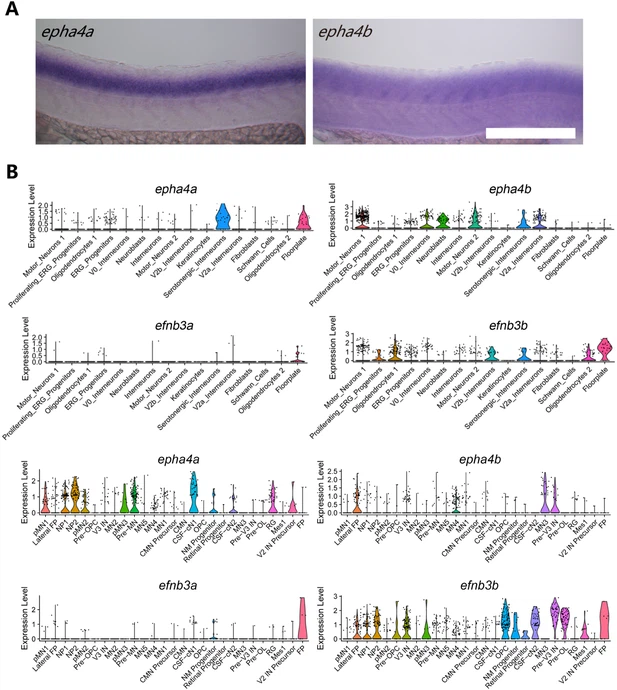
Fig. 7 - Supplemental 1 Expression pattern of epha4 and efnb3 in the spinal cord. (A) Whole-mount in situ hybridization results showing the expression of epha4a and epha4b genes in the spinal cord in 24 days post-fertilization (dpf) zebrafish larvae. (B) Violin plot showing epha4a, epha4b, efnb3a, and efnb3b gene expression in different cell types. Single-cell transcriptome data were acquired from two different studies (top and bottom) (Cavone et al., 2021; Scott et al., 2021). Scale bars: 200 µm in panel (A).
Acknowledgments
This image is the copyrighted work of the attributed author or publisher, and
ZFIN has permission only to display this image to its users.
Additional permissions should be obtained from the applicable author or publisher of the image.
Full text @ Elife