
|
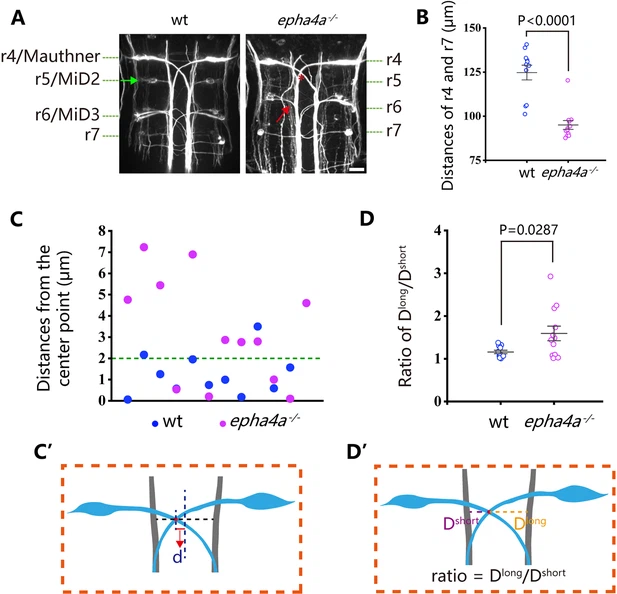
Fig. 5 Disorganized neural patterning in epha4a mutants. (A) Confocal images showing reticulospinal neuronal axons in 48 hr post-fertilization (hpf) wild-type and epha4a mutant larvae visualized with anti-neurofilament antibody RMO44. Asterisks indicate the cross sites of Mauthner axons. The green arrow indicates the cell body of the r5/MiD2 neuron in a wild-type larva. The red arrow points to the ipsilaterally projected axon of r6/MiD3 in the mutant larva, which is normally projected to the other side in wild-type fish. (B) Statistical chart showing the distance between r4 and r7 of 48 hpf wild-type and epha4a mutants. (C) Scatter plot showing the distance (d) between the center line and the intersection site of Mauthner axons as indicated in panel C′. (D) The ratio of the distance between the intersection site of Mauthner axons and bilateral axon bundles in 48 hpf wild-type (N=11 larvae) and epha4a mutants (N=12 larvae). The ratios were calculated as in panel D′. Scale bars: 20 µm in panel (A).