
|
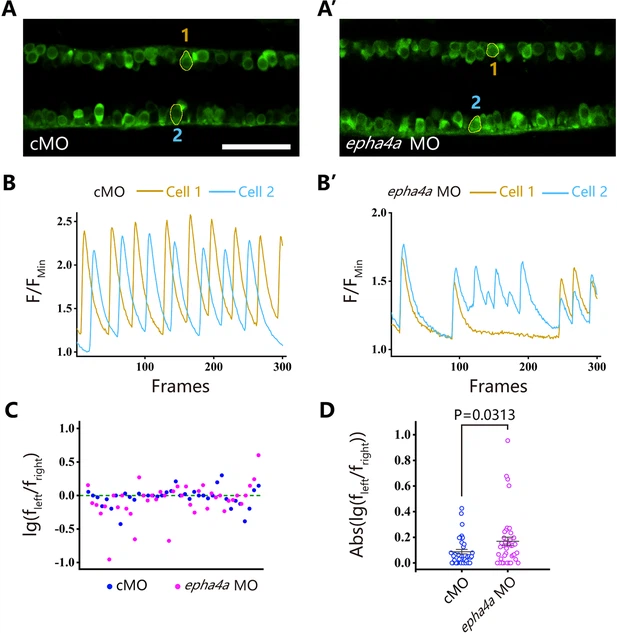
Fig. 4 - Supplemental 1 Uncoordinated left-right activation of spinal cord neurons in the absence of Epha4a. (A, A’) Fluorescent images showing the dorsal view of 24 hr post-fertilization (hpf) Tg(elavl3:GAL4; UAS:GCaMP) double transgenic larvae. The corresponding movies are shown in Videos 7 and 8. (B, B’) Line charts showing the quantification of fluorescence changes of the region of interests (ROIs, circled in A, A’) in control and epha4a morphants. (C) Scatter plot showing the distribution trend of the ratio of the calcium signal frequency between left and right in control (N=15 larvae, n=38 experiments) and epha4a morphants (N=15 larvae, n=41 experiments). (D) Statistical graph of the ratio of the calcium signal frequency between left and right in control and epha4a morphants. Scale bars: 50 μm in panels (A, A’).