
|
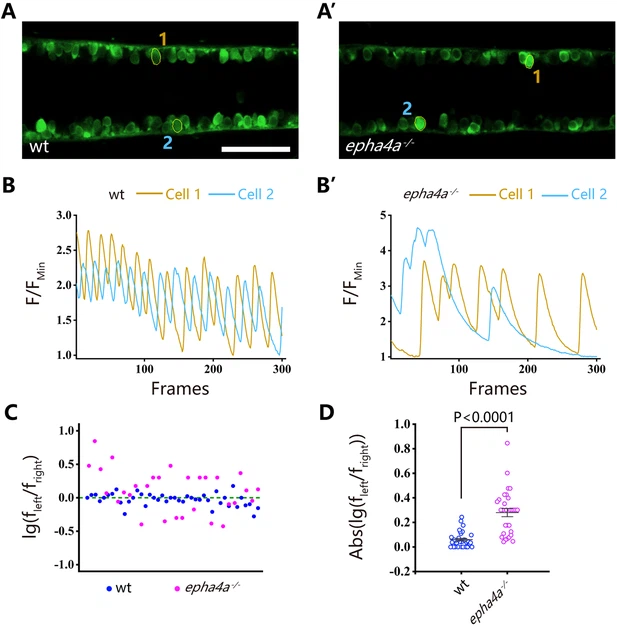
Fig. 4 Uncoordinated left-right activation of spinal cord neurons in epha4a mutants. (A, A’) Fluorescent images showing the dorsal view of 24 hr post-fertilization (hpf) Tg(elavl3:GAL4; UAS:GCaMP) double transgenic larvae. The corresponding movies are shown in Videos 5 and 6. (B, B’) Line charts showing the quantification of fluorescence changes of the region of interests (ROIs, circled in A, A’) in wild-type larvae and epha4a mutants. (C) Scatter plot showing the distribution trend of the ratio of the calcium signal frequency between left and right in wild-type (N=14 larvae, n=42 experiments) and epha4a mutants (N=10 larvae, n=30 experiments). (D) Statistical graph of the ratio of the calcium signal frequency between left and right in wild-type larvae and epha4a mutants. Scale bars: 50 μm in panels (A, A’).