IMAGE

Figure 3

ID
ZDB-IMAGE-250729-9
Source
Figures for Veshaal et al., 2025
Image
Figure Caption

Figure 3

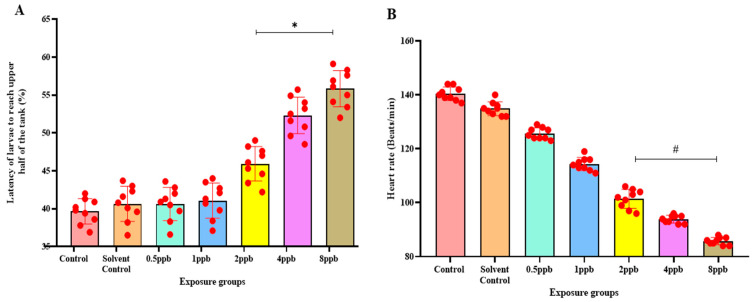
Percentage of latency to reach the upper half by zebrafish larvae exposed to different concentrations of BHA, control, and solvent control. * represents p < 0.05 statistically significant increase compared with control. (A) (n = 5). Percentage of time spent in the upper half by zebrafish larvae exposed to different concentrations of BHA, control, and solvent control. # represents p < 0.05 statistically significant decrease compared with control (B) (n = 5). Percentage of time spent in the dark region by zebrafish larvae exposed to different concentrations of BHA, control, and solvent control. * represents p < 0.05 statistically significant increase compared with control (C) (n = 5). Number of transitions from light to dark by zebrafish larvae exposed to different concentrations of BHA, control, and solvent control. # represents p < 0.05 statistically significant decrease compared with control (D) (n = 5). Percentage of time taken to reach the object in 3 h by zebrafish larvae exposed to different concentrations of BHA, control, and solvent control. * represents p < 0.05 statistically significant increase compared with control (E) (n = 5). Percentage of time spent near the object in 3 h by zebrafish larvae exposed to different concentrations of BHA, control, and solvent control. # represents p < 0.05 statistically significant decrease compared with control (F) (n = 5).

Figure Data
Acknowledgments
This image is the copyrighted work of the attributed author or publisher, and ZFIN has permission only to display this image to its users. Additional permissions should be obtained from the applicable author or publisher of the image. Full text @ J Xenobiot