
Fig. 6
- ID
- ZDB-IMAGE-250729-87
- Antibodies
- Publication
- Wu et al., 2025 - Mitochondrial dysfunction is driven by imbalanced fission and fusion of mitochondria in myofibrillar myopathy type 5
- All Figures
- Figures for Wu et al., 2025
|
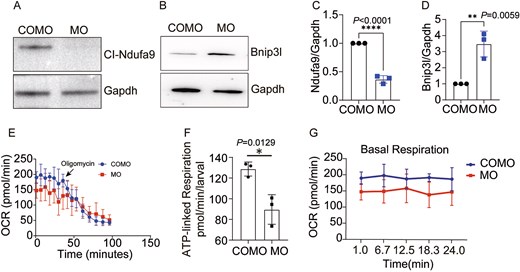
Fig. 6 (A-D) Ndufa9 (located in complex I) protein expression was significantly down-regulated in the MO group. Bnip3l protein expression was significantly elevated in the MO group compared with the COMO group. (E) Figure showing the oxygen consumption rate (OCR) curves of the COMO group and the MO group. The difference in the OCR between the COMO group and the MO group before and after the addition of oligo was significant, and the arrow indicates the time of oligo addition (n = 3). (F) The statistical analysis of ATP production capacity (n = 3). (G) Determination of the basic OCR of zebrafish (n = 3). All the data are shown as the means ± SDs. *P < 0.05, **P < 0.01, ***P < 0.001. Statistical significance was calculated via Student’s two-tailed t test.