
Image
|
Figure Caption
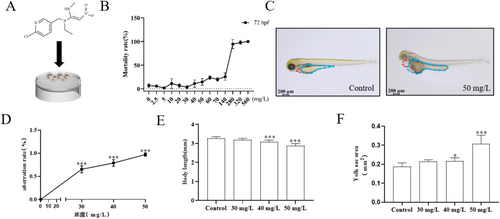
Fig. 1 Nitenpyram induced developmental toxicity in zebrafish embryos. (A) Molecular structure of nitenpyram and schematic representation of zebrafish exposure. (B) Mortality rate at 72 hpf, n = 3. (C) Phenotypes of zebrafish embryos in control group and exposed to 50 mg/L nitenpyram at 72 hpf. The red outline indicates the heart region, and the blue outline indicates the yolk sac area. (D) Abnormality rate at 72 hpf, n = 3. (E) Body length at 72 hpf, n = 10. (F) Yolk sac area at 72 hpf, n = 10, *p < 0.05, **p < 0.01, ***p < 0.001; mean ± S.D.
Acknowledgments
This image is the copyrighted work of the attributed author or publisher, and
ZFIN has permission only to display this image to its users.
Additional permissions should be obtained from the applicable author or publisher of the image.
Full text @ J. Appl. Toxicol.