IMAGE

Figure 5

ID
ZDB-IMAGE-250728-23
Source
Figures for Boi et al., 2025
Image
Figure Caption

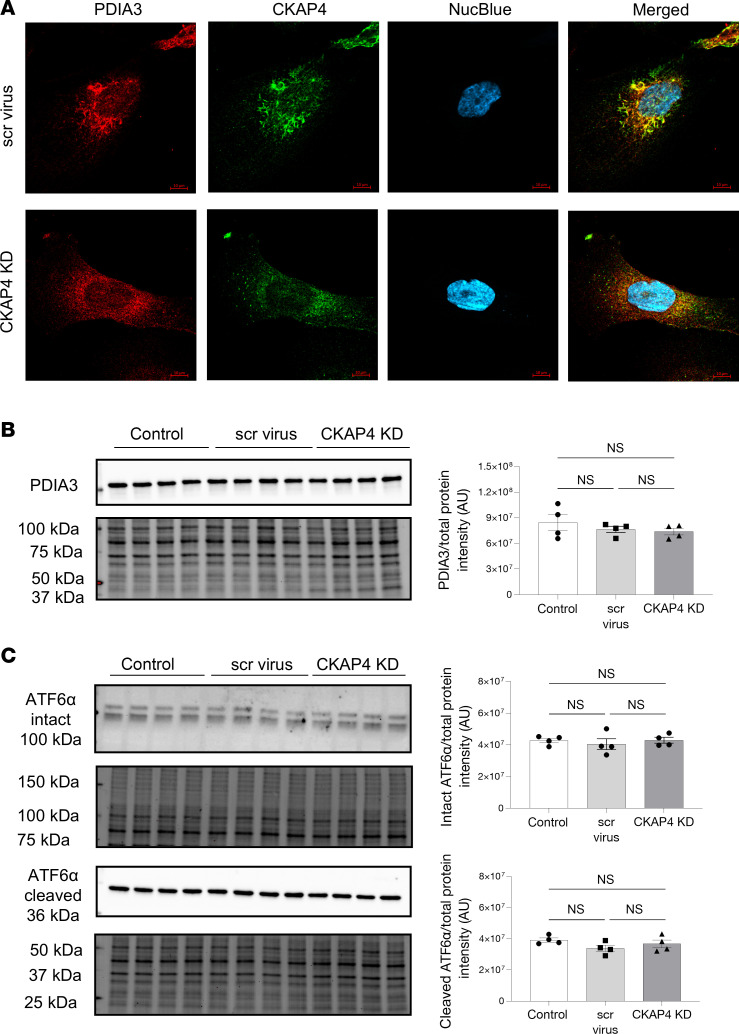
Figure 5 CKAP4 KD in vitro influences the shape of the ER in HPODs.

Immunofluorescence staining of the ER marker PDIA3 in scr control and CKAP4 KD HPODs. Scale bars: 10 μm. (A). Protein expression of PDIA3 was quantified in untreated control, scr control, and CKAP4 KD HPODs using Western blot (B). Protein expression of ER stress marker intact and cleaved ATF6α in untreated control, scr control, and CKAP4 KD HPODs was quantified by Western blot (C). The total protein blots used for normalization are shown below each Western blot, and the quantification graphs are shown on the left side of the panel. B: n = 4 per group. Tukey’s post hoc after 1-way ANOVA. Error bars represent average ± SEM. AU, arbitrary units; CKAP4, cytoskeleton associated protein 4; PDIA3, protein disulfide-isomerase A3; ER, endoplasmic reticulum; KD, knockdown; HPODs, human podocytes; scr, scrambled; ATF6α, activating transcription factor 6α.

Acknowledgments
This image is the copyrighted work of the attributed author or publisher, and ZFIN has permission only to display this image to its users. Additional permissions should be obtained from the applicable author or publisher of the image. Full text @ JCI Insight