
|
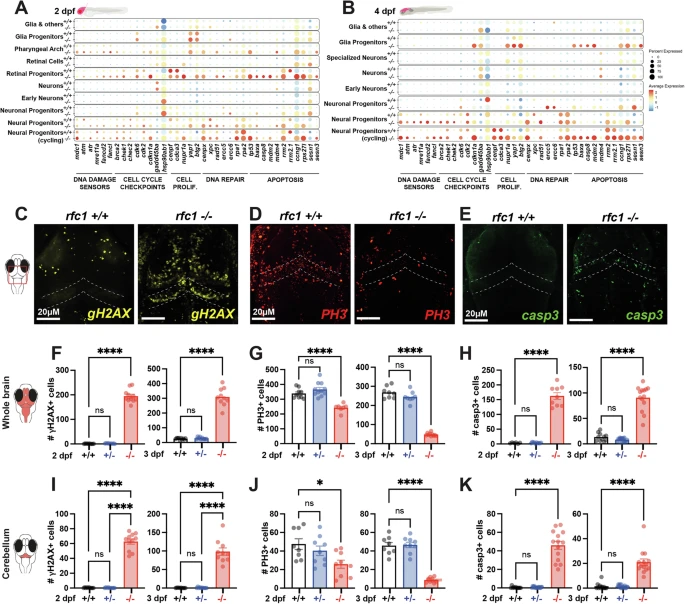
Fig. 5 RFC1 loss-of-function impairs neural progenitor proliferation and induces cell death.A, B Dot plots showing the expression of genes related to DNA damage sensing, cell cycle checkpoints, proliferation, DNA repair, and apoptosis across individual scRNA-seq clusters at 2 dpf (A) and 4 dpf (B) in rfc1+/+ and rfc1−/− brains (see Supplementary Fig. S4B, C for cluster annotations). Icons are created in BioRender. Samarut, E. (2025) https://BioRender.com/k7eukl7. C–E Immunostaining in the developing brain at 3 dpf using: C anti-γH2AX antibody (marker of DNA double-strand breaks), D anti-phospho-Histone H3 (PH3) antibody (mitotic marker), E anti-cleaved caspase-3 (casp3) antibody (apoptosis marker). Dotted lines delineate the developing cerebellum. F–H Quantification of γH2AX⁺, PH3⁺, and caspase-3⁺ cells in the whole brain of rfc1+/+, rfc1+/–, and rfc1–/– larvae at 2 and 3 dpf. F γH2AX-positive cells: 2 dpf (n = 10 rfc1+/+, 9 rfc1+/–, 11 rfc1–/–), 3 dpf (n = 10 rfc1+/+, 10 rfc1+/–, 10 rfc1–/–), N = 2. G PH3-positive cells: 2 dpf (n = 9 rfc1+/+, 11 rfc1+/–, 7 rfc1–/–), 3 dpf (n = 8 rfc1+/+, 8 rfc1+/–, 8 rfc1–/–), N = 2. H Casp3-positive cells: 2 dpf (n = 6 rfc1+/+, 10 rfc1+/–, 9 rfc1–/–), 3 dpf (n = 11 rfc1+/+, 15 rfc1+/–, 14 rfc1–/–), N = 3. (I–K) Quantification of γH2AX⁺ (I), PH3⁺ (J), and caspase-3⁺ (K) cells in the cerebellum of rfc1+/+, rfc1+/–, and rfc1–/– larvae at 2 and 3 dpf. I γH2AX-positive cells: 2 dpf (n = 10 rfc1+/+, 10 rfc1+/–, 11 rfc1–/–), 3 dpf (n = 10 rfc1+/+, 10 rfc1+/–, 10 rfc1–/–), N = 2. J PH3-positive cells cells: 2 dpf (n = 8 rfc1+/+, 9 rfc1+/–, 9 rfc1–/–), 3 dpf (n = 8 rfc1+/+, 9 rfc1+/–, 10 rfc1–/–), N = 2. K Casp3-positive cells: 2 and 3 dpf (n = 11 rfc1+/+, 15 rfc1+/–, 14 rfc1–/–), N = 3. Data in (F–K) are presented as mean ± SEM; individual dots represent biological replicates. Statistical analysis: one-way ANOVA with multiple comparisons. ns not significant (p > 0.05); * (p ≤ 0.05); ** (p ≤ 0.01); *** (p ≤ 0.001); **** (p ≤ 0.0001). Scale bars: 20 μm (A–C), 1 μm (D).