
Image
|
Figure Caption
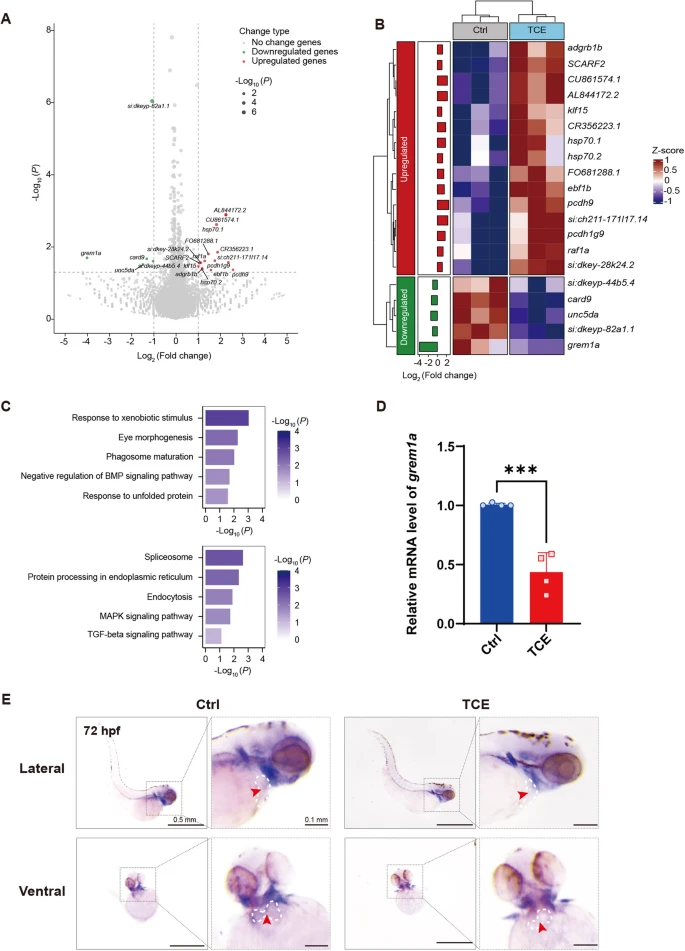
Fig. 2 TCE exposure down-regulated the level of grem1a in zebrafish. A Volcano plot and B hot map of DEGs analysis of bulk RNA sequencing from 12 hpf zebrafish embryos. C GO enrichment terms (above) and KEGG pathways (below) enriched from DEGs. D Relative mRNA expression change of 12 hpf zebrafish embryos measured by RT-qPCR. E Whole-mount in situ hybridization of gene grem1a in 72 hpf zebrafish (n = 15). The hearts were circled by white dashed line and indicated by red arrows. Ctrl, control. TCE, trichloroethylene, 760 nM. ***, P < 0.001 vs control
Acknowledgments
This image is the copyrighted work of the attributed author or publisher, and
ZFIN has permission only to display this image to its users.
Additional permissions should be obtained from the applicable author or publisher of the image.
Full text @ Cell Commun. Signal.