
Image
|
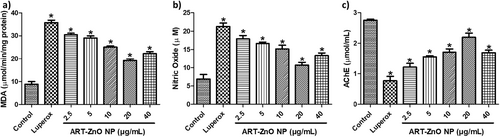
Figure Caption
Fig. 12 (a) MDA, (b) NO, and (c) AChE 1evel in the zebrafish larvae exposed to Luperox-induced oxidative stress (96 hpf). Data represented as mean ± standard deviation (n = 30/group). Significant data (p < 0.05) are marked with “*”.
Acknowledgments
This image is the copyrighted work of the attributed author or publisher, and
ZFIN has permission only to display this image to its users.
Additional permissions should be obtained from the applicable author or publisher of the image.
Full text @ J. Biochem. Mol. Toxicol.