
Image
|
Figure Caption
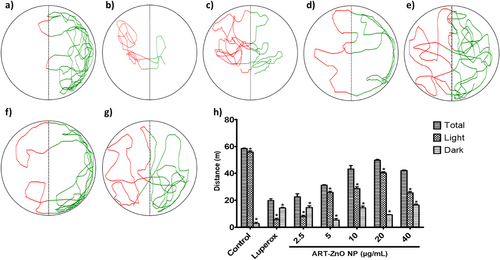
Fig. 9 Neurological behavioural analysis of the zebrafish larvae exposed to Luperox-induced oxidative stress using a light-dark chamber. (a) control, (b) Luperox (1 mM), (c) 2.5 µg/mL, (d) 5 µg/mL, (e) 10 µg/mL, (f) 20 µg/mL, (g) 40 µg/mL, (h) distance travelled by the larvae (meters). The data were considered significant (p < 0.05) and marked by the symbol “*”.
Acknowledgments
This image is the copyrighted work of the attributed author or publisher, and
ZFIN has permission only to display this image to its users.
Additional permissions should be obtained from the applicable author or publisher of the image.
Full text @ J. Biochem. Mol. Toxicol.