
Image
|
Figure Caption
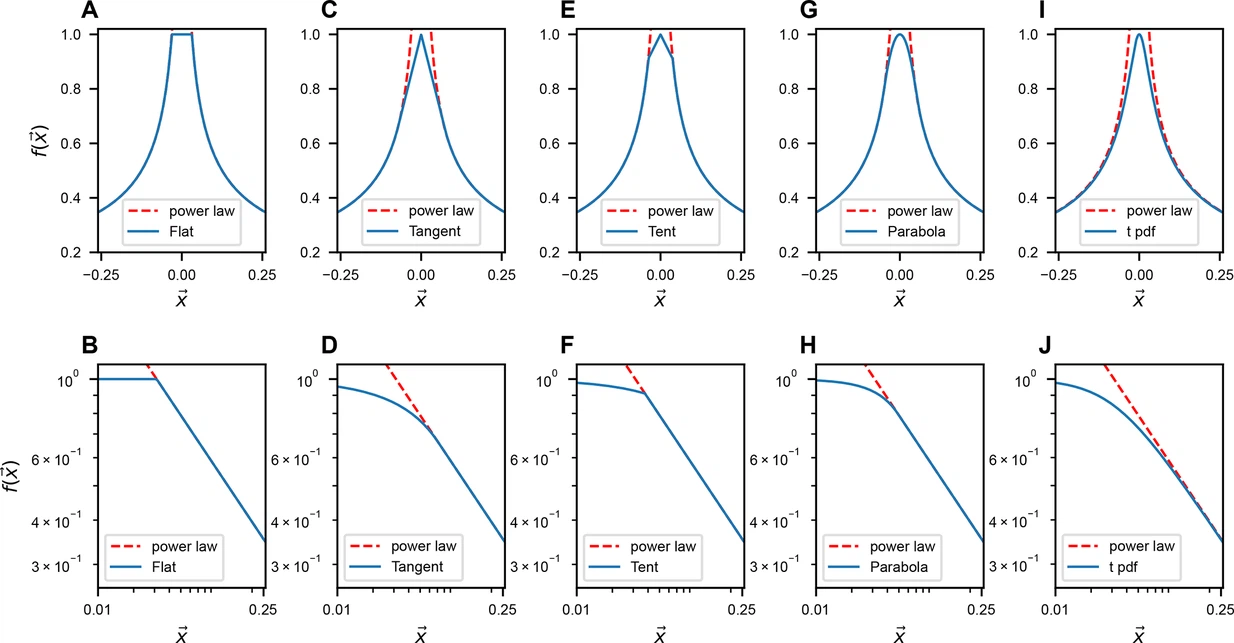
Fig. Appendix Figure 3 Modifications of f(x⃗ ) near x=0 . The upper row illustrates the slow-decaying kernel function f(x⃗ ) (blue solid line) and its power-law asymptote (red dashed line) along a 1D slice at various f(x⃗ ) . The lower row is similar to A, but on the log–log scale. The formulas for different f(x⃗ ) ’s are listed in Table 3 in Methods.
Acknowledgments
This image is the copyrighted work of the attributed author or publisher, and
ZFIN has permission only to display this image to its users.
Additional permissions should be obtained from the applicable author or publisher of the image.
Full text @ Elife