
Image
|
Figure Caption
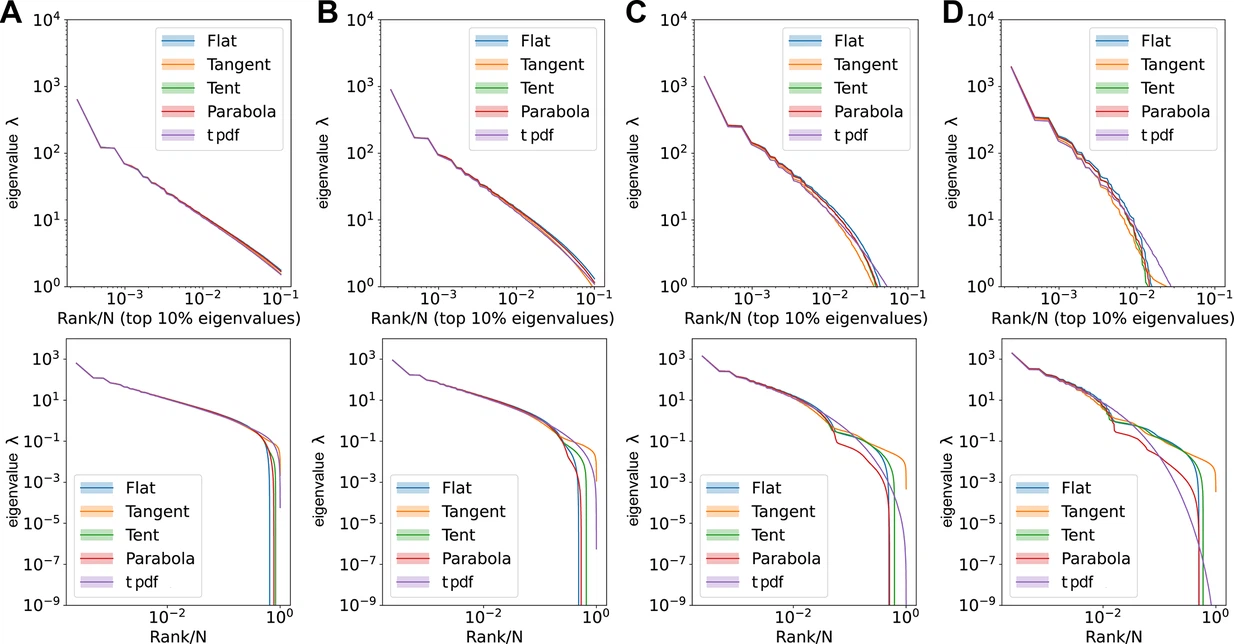
Fig. Appendix Figure 2 Comparisons of large eigenvalues across different smoothing interval sizes, ε. Rank plot (upper row) and pdf (lower row) of the covariance eigenspectrum for ERMs with different f(x⃗ ) . (A) ϵ=0.06 . (B) ϵ=0.12 . (C) ϵ=0.3 . (D) ϵ=0.6 . Other ERM simulation parameters: N=4096 , ρ=100 , μ=0.5 , d=2 , L=6.4 , σ2i=1 . The formulas for different f(x⃗ ) ’s are listed in Table 3 in Methods.
Acknowledgments
This image is the copyrighted work of the attributed author or publisher, and
ZFIN has permission only to display this image to its users.
Additional permissions should be obtained from the applicable author or publisher of the image.
Full text @ Elife