
|
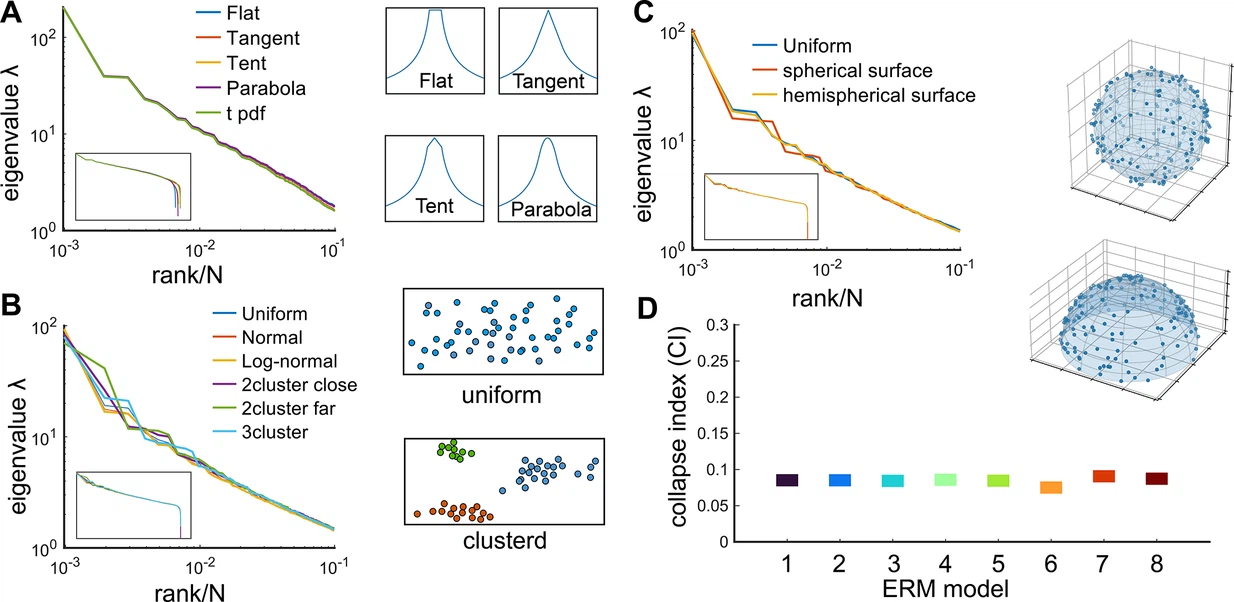
Fig. Appendix Figure 1 Factors that do not affect the scale invariance. (A) Rank plot of the covariance eigenspectrum for ERMs with different f(x⃗ ) (see Table 3). Diagrams show different slow-decaying kernel functions f(x⃗ ) along a 1D slice. (B) Same as A but for different coordinate distributions in the functional space (see text). The diagrams on the right illustrate uniform and clustered coordinate distributions. (C) Same as A but for different geometries of the functional space (see text). Diagrams illustrate spherical and hemispherical surfaces. (D) CI of the different ERMs considered in (A–C). The range on the y-axis is identical to Figure 4C. On the x-axis, 1: uniform distribution, 2: normal distribution, 3: log-normal distribution, 4: uniform two nearby clusters, 5: uniform two faraway clusters, 6: uniform 3-cluster, 7: spherical surface in R3 , 8: hemispherical surface in R3 . All ERM models in (B, C) are adjusted to have a similar distribution of pairwise correlations (Appendix 1).