
|
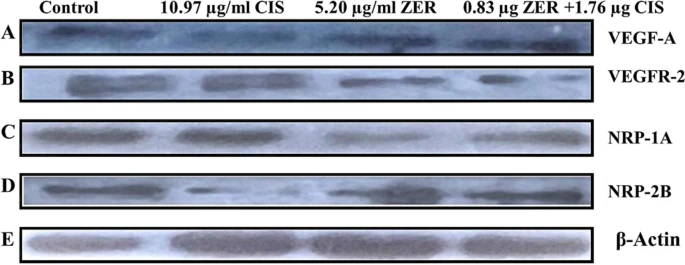
Fig. 6 Western blot images showing angiogenic protein (VEGF-A, VEGFR-2, NRP-1A, NRP-2B expression with β actins in Zebra fish larvae. Pictorial representation of the blot images indicates that in (A). Note the consistent reduction of VEGF–A protein expression, irrespective of the treatment groups. B indicates the marginal increase in the expression of VEGFR-2 in CIS alone treated group, while ZER either alone or in combination with CIS reduced the expression of VEGFR-2 expression. C Note the marginal increase in the Nrp-1A expression in CIS alone treated group, while ZER alone or combination dose down-regulated the Nrp-1A expression. D reveals that Nrp-2B expression is reduced in CIS treated group, while ZER and combination treatment caused a mild increase in Nrp-2B expression. E shows the β—Actin protein expression was increased in control and in treated larvae