
Fig. 2
- ID
- ZDB-IMAGE-250708-48
- Publication
- Monfries et al., 2025 - frizzled5 mutant zebrafish are genetically sensitised to developing microphthalmia and coloboma
- All Figures
- Figures for Monfries et al., 2025
|
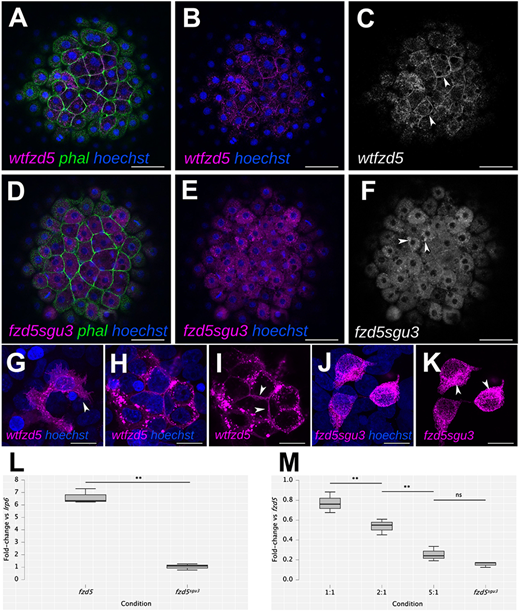
Fig. 2 The Fzd5sgu3 protein fails to localise to the cell membrane. (A-K) Cell membrane localisation of wild-type Fzd5-RFP (wt-fzd5-RFP; magenta in A,B,G-I; grey in C; arrowheads in C,G,I) and punctate cytoplasmic accumulation of Fzd5sgu3-RFP (magenta in D,E,J,K; grey in F; arrowheads in F,K) in 4 hpf embryos injected with the corresponding mRNA (A-F), or in HEK293 cells transfected with the corresponding DNA construct (G-K). Embryos were counterstained with phalloidin-488 to reveal cell outlines (green) and Hoechst to reveal cell nuclei (blue). (L) Fold change in luciferase activity of HEK293 cells transfected with lrp6+wt-fzd5-myc and lrp6+fzd5sgu3-myc normalised to activity of lrp6 alone. (M) Fold change in luciferase activity of co-transfections with lrp6+wt-fzd5-myc and increasing levels of fzd5sgu3-myc normalised to activity of lrp6+wt-fzd5-myc alone. Pairwise multiple Student’s t-test comparison between conditions in L and M reveal statistically significant changes in luciferase activity (L, P=0.002; M, P=0.007, P=0.003, P=0.091 from left to right). ns, not significant; **P<0.01. Data pooled from three experiments with four replicates each. Scale bars: 50 µm (A-F) or 10 µm (G-K).