
|
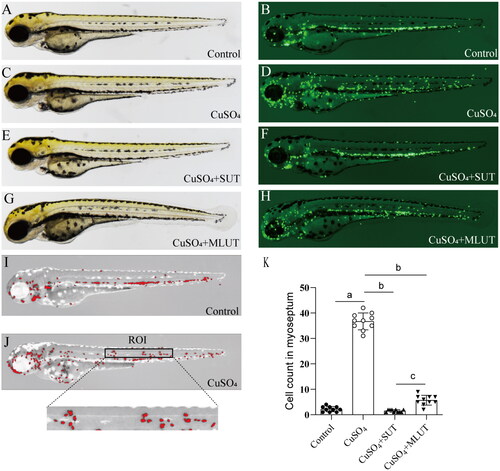
Fig. 2 Quantification of macrophage migration in zebrafish larvae exposed to SUT and MLUT uremic solution. (A-H) Representative bright field and fluorescent images of TG (zlyz:EGFP) larvae at 3 days postfertilization (dpf). (A and B) Untreated fish show the normal distribution of labeled cells, mostly localized in the ventral trunk and tail. (C and D) In copper-treated siblings, macrophages become localized preferentially to a few clusters along the horizontal midline of the trunk and tail. Compared with copper-treated only fish, fish treated with SUT solution (E and F) or MLUT solution (G and H) significantly inhibited macrophage migration induced by copper sulfate. (I and J) Quantification of the macrophage number in myoseptum. (K) Quantification of macrophage migration in zebrafish larva. The number of migrated macrophages was significantly reduced in the SUT and MLUT groups compared to the control group (P < 0.05). Columns, mean; bars, SEM (n = 10; ANOVA; a, vs Control; b, vs CuSO4; c, SUT vs MLUT, P < 0.05).