
Image
|
Figure Caption
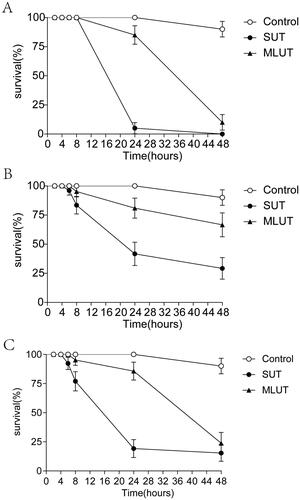
Fig. 1 Survival curves of zebrafish larvae exposed to different uremic solutions. Survival curves of zebrafish treated with uremic solutions from patients 1 (A), 2 (B), and 3 (C). Error bars represent the mean and standard deviation of the survival rate (n = 20 per group). Survival rates were significantly lower in the SUT and MLUT groups than in the control group (P < 0.05).
Acknowledgments
This image is the copyrighted work of the attributed author or publisher, and
ZFIN has permission only to display this image to its users.
Additional permissions should be obtained from the applicable author or publisher of the image.
Full text @ Ren Fail