IMAGE

Fig 6

ID
ZDB-IMAGE-250705-15
Source
Figures for Rissone et al., 2025
Image
Figure Caption

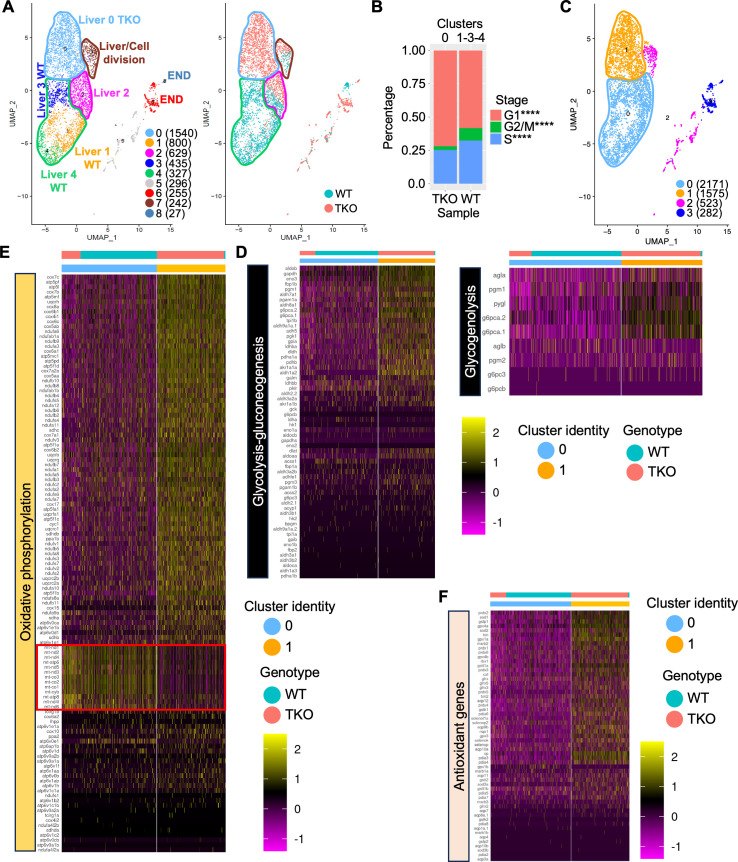
Fig 6 Single cell RNA-sequencing of 4 dpf WT and TKO dsRED

+cells.(A) (Left) UMAP showing the clustering of merged WT and TKO dsRED+ cells. Liver and endocrine pancreatic cell cluster identity has been annotated in the plot. The total number of cells in each cluster in shown in parenthesis. (Right) UMAP displaying the projection of the two genotypes (WT and TKO) merged for the analysis. Major liver clusters have been highlighted. (B) Analysis of the cell cycle using Seurat CellCycleScoring function in WT and TKO hepatic cells. Statistical significance was determined using Fisher’s exact test. **** < 0.0001. (C-F) Heat maps showing expression of metabolic genes involved in glycolysis/gluconeogenesis and glycogenolysis (D), oxidative phosphorylation (E), and antioxidant genes (F) at single-cell level in WT and TKO liver cell clusters highlighted in the specific UMAP (C). Numbers in parenthesis indicate the total number of cells for each cluster.

Acknowledgments
This image is the copyrighted work of the attributed author or publisher, and ZFIN has permission only to display this image to its users. Additional permissions should be obtained from the applicable author or publisher of the image. Full text @ PLoS Genet.