IMAGE

Fig 5

ID
ZDB-IMAGE-250705-14
Source
Figures for Rissone et al., 2025
Image
Figure Caption

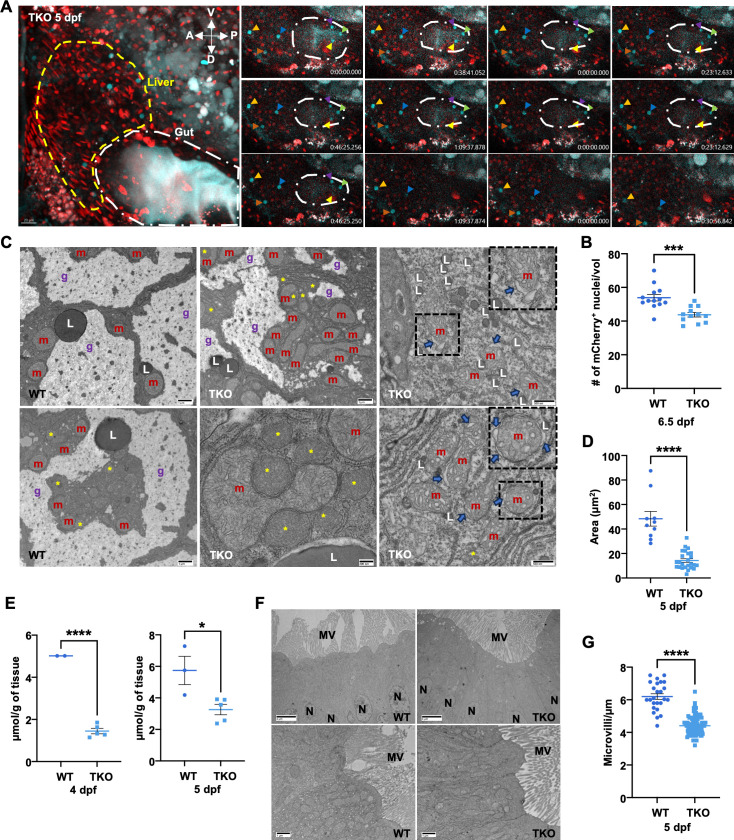
Fig 5 Liver and gut defects observed in TKO embryos.

(A) (Left) Representative max-projection of confocal Z-stacks of a FUCCI TKO embryo at 5 dpf. The dashed yellow and white lines highlight the left lobe liver and the gut, respectively. Lateral views, anterior to the left and dorsal to the bottom. Scale bar, 20 μm. (Right) Pictures of the same single plane over time from each confocal Z-stack. For clarity, only the gut region is highlighted with a white long-dashed dot line. Arrowheads point at the same cerulean+ cells over time. Numbers indicate the time of each frame; each hour the timer is restarting from zero. (B) Quantification of the number of G0/G1 nuclei per volume (39µm3) in the left lobe of the liver of WT and TKO at 6.5 dpf. (C) Representative EM pictures showing subcellular organization of hepatocytes in 5 dpf WT and TKO embryos. Different grades of severity have been observed in TKO hepatocytes. Dashed black rectangles highlight the insets. m, mitochondria, L, lipid droplets, g, glycogen lacunae, yellow asterisks mark the peroxisomes. Blue arrows point to mitochondria showing signs of distress (intracristal swelling and blistering of the external membrane). Specific scale bars are indicated for each picture. (D-E) Quantitative analysis of glycogen content in WT and TKO at different stages. (D) Analysis performed using ImageJ (Fiji) on EM images at the same magnification from WT and TKO at 5dpf. (E) Glucose content (μmol/grams of embryonic tissue) quantification after amyloglucosidase digestion in WT and TKO embryos at 4 and 5 dpf. (F) Representative EM pictures comparing gut epithelial cells in WT and TKO 5 dpf embryos. Scale bars, 4 μm (top) and 1 μm (bottom). N, nucleus, MV, microvilli. (G) Quantification of the microvilli density (# of microvilli/µm) in 5 dpf WT and TKO gut epithelial cells. The data represent means ± SEM. Statistical significance was determined by unpaired two-tailed t-tests. * < 0.05, *** < 0.001 and **** < 0.0001.

Figure Data
Acknowledgments
This image is the copyrighted work of the attributed author or publisher, and ZFIN has permission only to display this image to its users. Additional permissions should be obtained from the applicable author or publisher of the image. Full text @ PLoS Genet.