
Fig. 6
- ID
- ZDB-IMAGE-250703-63
- Publication
- Kassel et al., 2025 - The TRIP12 E3 ligase induces SWI/SNF component BRG1-β-catenin interaction to promote Wnt signaling
- All Figures
- Figures for Kassel et al., 2025
|
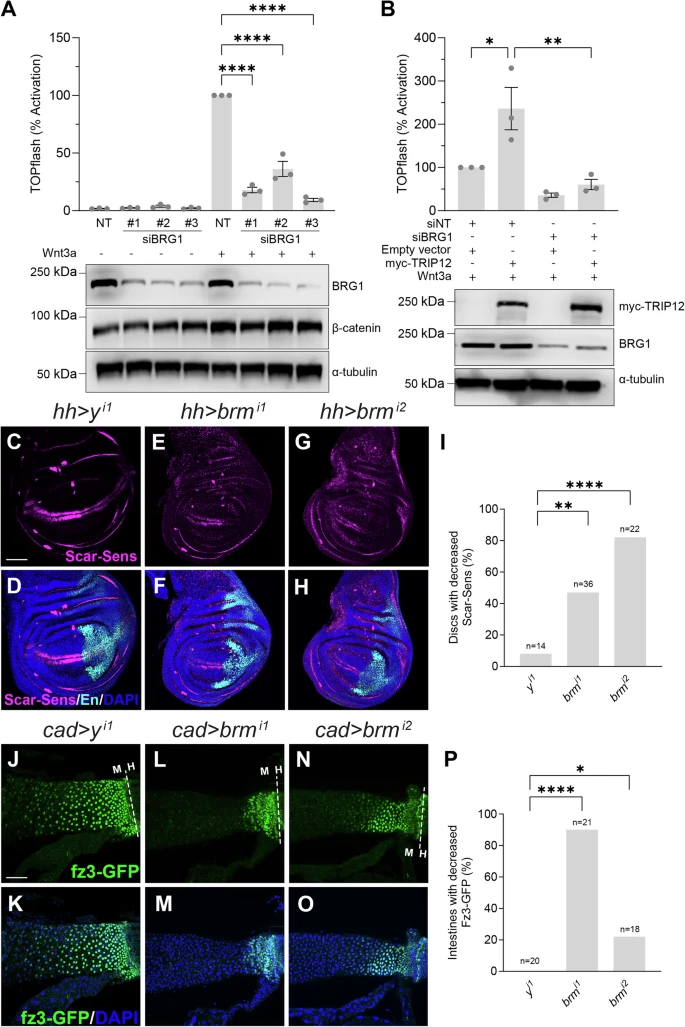
Fig. 6 BRG1 promotes Wnt/Wingless signaling.A HEK293STF cells transfected with nontargeting (siNT) control or three independent BRG1 siRNAs (siBRG1 #1, #2, and #3), incubated in the absence or presence of recombinant Wnt3a. TOPflash reporter quantified, and cell extracts immunoblotted for BRG1 and β-catenin. For A and B, graphs show mean ± SEM of TOPflash normalized to cell number and NT control. Significance assessed using one-way ANOVA with Dunnett’s test. All TOPflash results and immunoblots represent at least three independent experiments. n = 3 wells of cells per treatment group per experiment. α-tubulin is a loading control. p-values for siNT + Wnt3a versus siBRG1#1 + Wnt3a, siBRG1#2 + Wnt3a, and siBRG1#3 + Wnt3a are all <0.0001. B HEK293STF cells transfected with indicated expression constructs and incubated in the presence of recombinant Wnt3a. TOPflash reporter activity quantified, and cell extracts immunoblotted for Myc-TRIP12 and BRG1. p-value for siNT versus siNT + myc-TRIP12 is 0.0218 and for siNT + myc-TRIP12 versus siBRG1 + myc-TRIP12 is 0.0052. C–H RNAi constructs targeting yellow (y) control or brahma (brm) expressed in posterior compartment (marked by Engrailed (En, cyan)) of third instar larval wing discs using hedgehog (hh)-Gal4. Scarlet-Senseless (Scar-Sens, magenta) is a Wingless target gene reporter. C, D hh-Gal4-driven expression of y RNAi. Minimal loss of Scar-Sens was observed. E–H hh-Gal4-driven expression of independent RNAi targeting brm resulted in decreased Scar-Sens in the posterior compartment. Dorsal, top, and posterior, right. I Quantification is the percentage of discs with decreased Scar-Sens. N is number of wing discs analyzed. J–O RNAi constructs targeting y control or brm in posterior midgut using cad-Gal4. frizzled3-GFP (fz3-GFP, green) is a Wingless target gene reporter. J, K cad-Gal4-driven expression of y control RNAi. No fz3-GFP reduction was observed. L–O cad-Gal4-driven expression of brm RNAi resulted in partial loss of fz3-GFP. P Quantification shown as percentage of intestines with decreased fz3-GFP. N is the number of adult intestines analyzed. DAPI (blue) marks nuclei. Scale bar (C–H, J–O): 50 μm. Statistical significance (I, P) was analyzed by Fisher’s exact test (two-sided). p-values for I are 0.0090 and <0.0001. p-values for P are <0.0001 and 0.0415. *p < 0.05, **p < 0.01, ****p < 0.0001. Source data are provided.