
Fig. 5
- ID
- ZDB-IMAGE-250703-62
- Publication
- Kassel et al., 2025 - The TRIP12 E3 ligase induces SWI/SNF component BRG1-β-catenin interaction to promote Wnt signaling
- All Figures
- Figures for Kassel et al., 2025
|
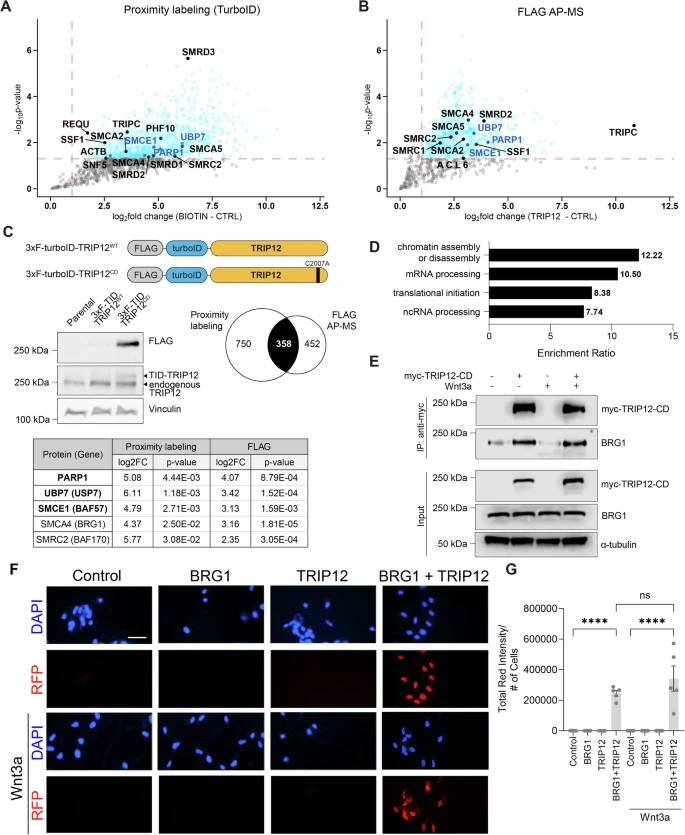
Fig. 5 TRIP12 interacts with BRG1.A Volcano plot of significantly enriched proteins in proximity labeling of 3xFLAG-turboID-TRIP12C2007A. HEK293T cells were treated with biotin or not and analyzed using label-free LC-MS/MS. Proteins with a change of greater than 1.5-fold (log2 > 0.6), p < 0.05 (n = 3 independent biological replicates, two-tailed t-test) in ±biotin comparison are in cyan. For A and B, proteins in dark blue are known interactors of TRIP12, and proteins in black are known components of SWI/SNF. B Volcano plot of significantly enriched proteins in 3xFLAG-TRIP12C2007A immunoprecipitation versus control and analyzed by AP/MS. Proteins with a change of greater than 1.5-fold (log2 > 0.6), p < 0.05 (n = 3 independent biological replicates, two-tailed t-test) in 3x-FLAG-TRIP12C2007A/control comparison are in cyan. C Schematic of N-terminal 3xFLAG-turboID biotin ligase-tagged TRIP12WT and catalytically inactive TRIP12C2007A and their immunoblot in HEK293T cell lysates. Venn diagram comparing TRIP12 interactors identified by proximity labeling and AP/MS. Among the commonly identified proteins were the known TRIP12 interactors PARP1, USP7, and BAF57, and SWI/SNF components BRG1 and BAF170. D Over-representation analysis of 358 common and specific TRIP12 interactors revealed chromatin assembly and disassembly as the most enriched gene ontology (GO) term with an enrichment ratio of 12.22, FDR < 0.05. E HEK293FT cells transfected with Myc-TRIP12-CD, incubated in the presence or absence of recombinant Wnt3a. Myc-TRIP12-CD immunoprecipitated with Myc antibody. Coimmunoprecipitated, endogenous BRG1 detected by immunoblotting. Immunoblots representative of at least three independent experiments. α-tubulin is a loading control. F RPE cells treated in the absence or presence of recombinant Wnt3a for 4 h, immunostained for BRG1 and/or TRIP12, and a proximity ligation assay performed with quantitation (G). n = 5 images. Representative images are shown (n = 3 independent experiments). Graph shows mean ± SEM of total red intensity normalized to cell number. Significance assessed using one-way ANOVA with Tukey’s test. p-values for Control versus BRG1 + TRIP12 and Control + Wnt3a versus BRG1 + TRIP12 + Wnt3a are <0.0001. p-value for BRG1 + TRIP12 versus BRG1 + TRIP12 + Wnt3a is 0.3287. Scale bar: 50 μm. ****p < 0.0001, p ≥ 0.05 is not significant (ns). Source data are provided in the Source Data file.