
Image
|
Figure Caption
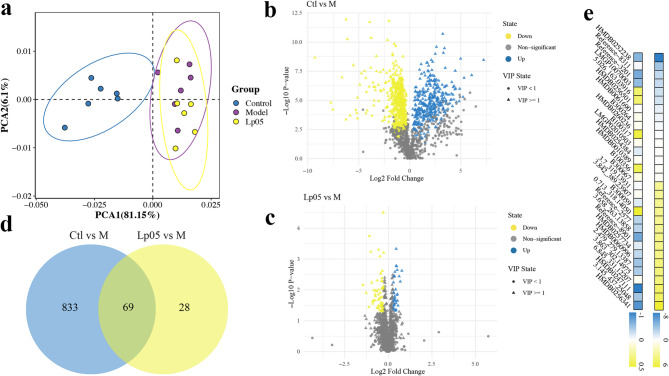
Fig. 6
Zebrafish Metabolic Figures. (a) PCA plot; (b) volcano plot of differential metabolites for Ctl and M; (c) volcano plot of differential metabolites for Lp05 and M; (d) venn diagram of differential metabolites between Ctl vs. M and Lp05 vs. M; (e) heatmap of the top 30 most differential metabolites of 69 differential metabolites. Ctl, the control group; M, model group; Lp05,
Acknowledgments
This image is the copyrighted work of the attributed author or publisher, and
ZFIN has permission only to display this image to its users.
Additional permissions should be obtained from the applicable author or publisher of the image.
Full text @ Sci. Rep.