
Fig. 2
- ID
- ZDB-IMAGE-250703-59
- Publication
- Kassel et al., 2025 - The TRIP12 E3 ligase induces SWI/SNF component BRG1-β-catenin interaction to promote Wnt signaling
- All Figures
- Figures for Kassel et al., 2025
|
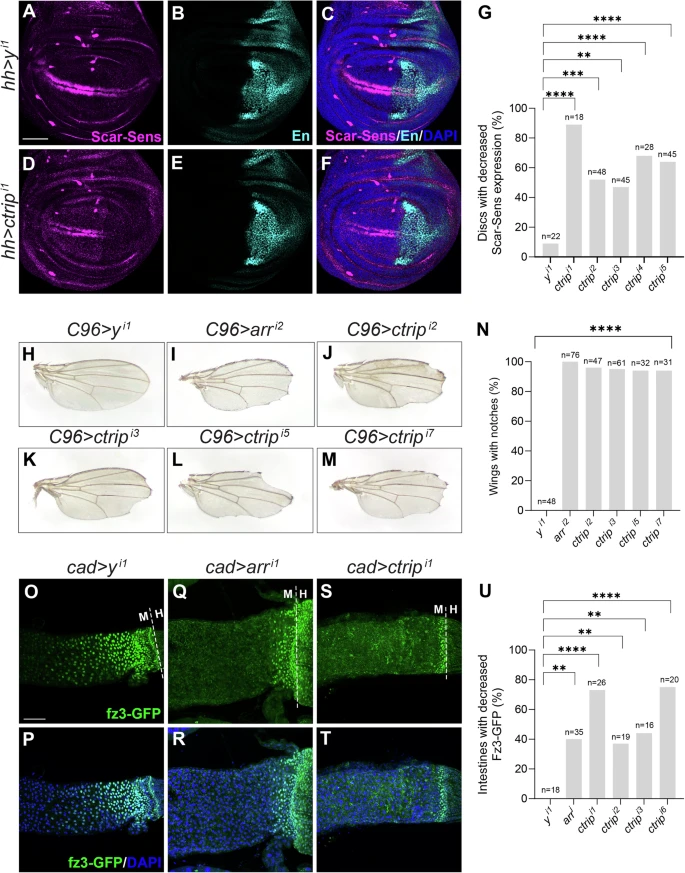
Fig. 2 Ctrip promotes Wingless signaling in Drosophila.RNAi constructs targeting yellow negative control or ctrip in the posterior compartment (marked by Engrailed (En, cyan)) of third instar larval wing discs using hedgehog (hh)-Gal4. Scarlet-Senseless (Scar-Sens, magenta) is a Wingless target gene reporter. DAPI (blue) marks nuclei. Scale bar (A–F): 50 μm. Dorsal, top; posterior, right. A–C hh-Gal4-driven expression of a yellow (y) RNAi control. Minimal loss of Scar-Sens was observed in the posterior compartment. D–F hh-Gal4-driven expression of RNAi construct targeting ctrip decreases Scar-Sens in the posterior compartment. G Quantification is the percentage of wing discs with decreased Scar-Sens. N is the number of wing discs analyzed. RNAi constructs targeting yellow, arrow (positive control), or ctrip expressed using the C96-Gal4 driver. H C96-Gal4-driven expression of RNAi construct targeting yellow (y). No wing notches were observed. I–M C96-Gal4-driven expression of RNAi constructs targeting arrow (arr) or ctrip resulted in notches at wing periphery. N Quantification for H–M is shown as percentage of wings with notches. N is the number of wings analyzed. RNAi constructs targeting yellow, arrow (arr), or ctrip expressed in posterior midgut using the cad-Gal4 driver. frizzled3-GFP (green) is a Wingless target gene reporter. The dashed line indicates the midgut-hindgut boundary (MHB). O, P cad-Gal4-driven expression of y. No fz3-GFP reduction was observed. Q, R cad-Gal4-driven expression of RNAi targeting arr results in loss of fz3-GFP near midgut-hindgut boundary. S, T cad-Gal4-driven expression of RNAi targeting ctrip results in partial or complete loss of fz3-GFP expression in posterior midgut. DAPI (blue) marks nuclei. Scale bar (O–T): 50 μm. U Quantification shown as percentage of intestines with decreased fz3-GFP. N is the number of adult intestines analyzed. Statistical significance (G, N, U) was analyzed by Fisher’s exact test (two-sided). p-values for G are <0.0001, 0.0005, 0.0024, <0.0001, <0.0001 respectively. p-values for N are all <0.0001. p-values for U are 0.0020, <0.0001, 0.0080, 0.0021, <0.0001, respectively. **p < 0.01, ***p < 0.001, ****p < 0.0001. Source data are provided in the Source Data file.