
Image
|
Figure Caption
Fig. 3
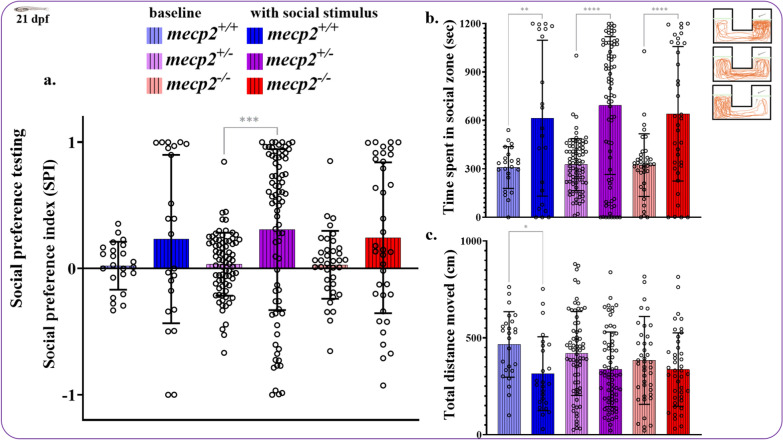
Social preference index, time spent in the social zone, and total distance moved by 21 dpf zebrafish during baseline and social stimulus phases. Social preference (
Figure Data
Acknowledgments
This image is the copyrighted work of the attributed author or publisher, and
ZFIN has permission only to display this image to its users.
Additional permissions should be obtained from the applicable author or publisher of the image.
Full text @ BMC Neurosci.