
Image
|
Figure Caption
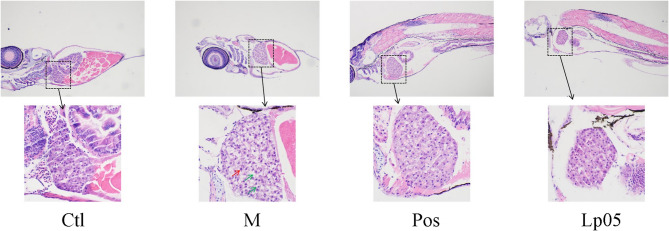
Fig. 4
Hiopathological section of zebrafish liver. Red arrows in the figure represent enlarged hepatocyte nucleus, and green arrows represent fatty vacuolar-like degeneration. Ctl, the control group; M, model group; Pos, positive control group; Lp05,
Acknowledgments
This image is the copyrighted work of the attributed author or publisher, and
ZFIN has permission only to display this image to its users.
Additional permissions should be obtained from the applicable author or publisher of the image.
Full text @ Sci. Rep.