
Image
|
Figure Caption
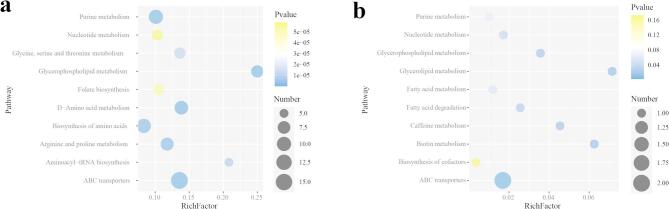
Fig. 7
KEGG Pathway Analysis of Differential Metabolites. (a) pathway map of differential metabolites for Ctl vs. M; (b) pathway map of differential metabolites for Lp05 vs. M. The size of the circles in the graph represents the number of differential metabolites contained in that pathway; the larger the circle, the more differential metabolites it contains. The bluer the circle color, more significant the pathway. Ctl, the control group; M, model group; Lp05,
Acknowledgments
This image is the copyrighted work of the attributed author or publisher, and
ZFIN has permission only to display this image to its users.
Additional permissions should be obtained from the applicable author or publisher of the image.
Full text @ Sci. Rep.