
|
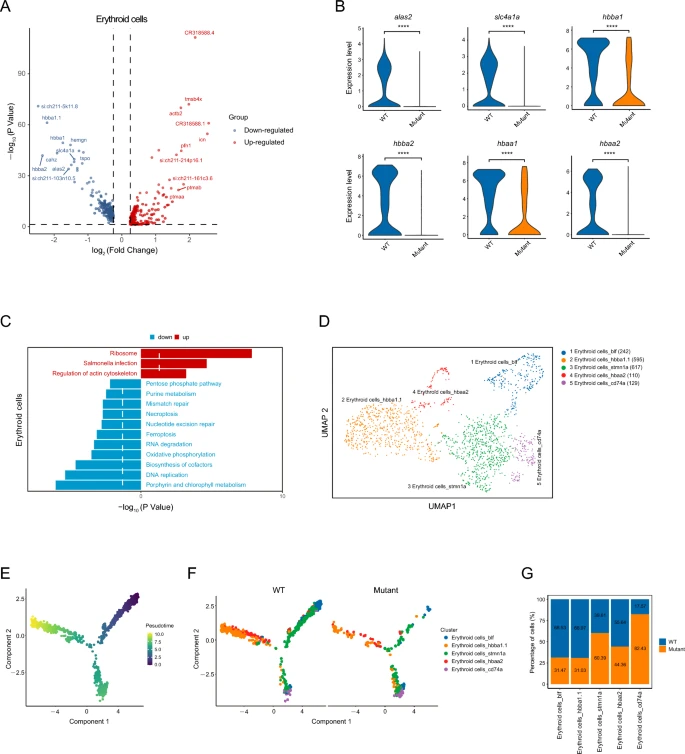
Fig. 4 Comparative analysis of erythroid cells between WT and creg1−/− fish. A Volcano diagram showing the DEGs in erythroid cells between WT and creg1−/− fish. B Violin plots showing the expression of alas2, slc4a1a, hbba1, hbba2, hbaa1, and hbaa2 in erythroid cells between WT and creg1−/− fish. C KEGG pathway enrichment analysis of DEGs in erythroid cells between WT and creg1−/− fish. D UMAP plot showing unsupervised subclustering of erythroid cells from both WT and creg1−/− kidney marrow. E, F Pseudotime trajectory analysis of erythroid cell subclusters. G Fraction of each subcluster of erythroid cells between WT and creg1−/− fish