
|
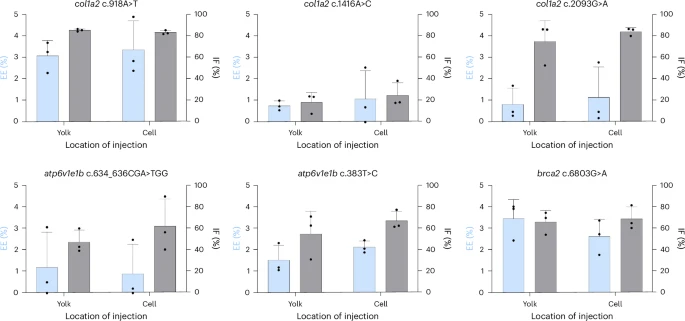
Fig. 2 Comparison of EE and IF obtained for each target by microinjection of Alt-R HDR components into the cell or the yolk.Zebrafish embryos at the one-cell stage were injected with 200 pg (col1a2 c.918A>T), 400 pg (col1a2 c.1416A>C, col1a2 c.2093G>A) or 800 pg (atp6v1e1b c.634_636CGA>TGG, atp6v1e1b c.383T>C, brca2 c.6803G>A) Cas9 into the cell or the yolk. Left-hand y axes show EE (blue) and right-hand y axes show IF (gray). Bars and error bars represent the mean + s.e.m. of three biologically independent replicates (n = 3), where each replicate represents a pool of 20–30 injected embryos. Unpaired t-test.