
Image
|
Figure Caption
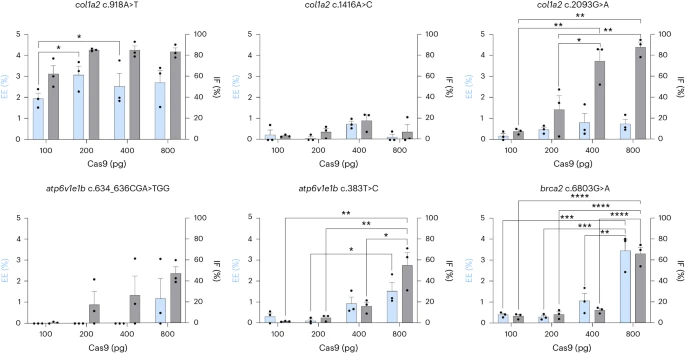
Fig. 1 Comparison of EE and IF obtained for each target by microinjection of Alt-R HDR components with 100, 200, 400 or 800 pg Cas9 into the yolk of one-cell-stage zebrafish embryos. Left-hand y axes show EE (blue) and right-hand y axes show IF (gray). The bars and error bars represent the mean + s.e.m. of three biologically independent replicates (n = 3), where each replicate represents a pool of 20–30 injected embryos. Tukey’s multiple-comparisons test: *P < 0.05, **P < 0.01, ***P < 0.001, ****P < 0.0001.
Acknowledgments
This image is the copyrighted work of the attributed author or publisher, and
ZFIN has permission only to display this image to its users.
Additional permissions should be obtained from the applicable author or publisher of the image.
Full text @ Lab Anim (NY)